Bitcoin has never moved in a straight line. Zoom out to any long-term chart and the same shape keeps appearing: a slow, quiet build — then a violent rally — then a collapse that wipes out most of the gains. That shape has a name: the Bitcoin cycle. And every cycle is loosely organised around a single event: the halving.
This is Part 7 of eight. You've spent the previous parts learning how to read individual on-chain metrics — MVRV, holder cohorts, SOPR, realized profit and loss, NUPL. In this part we zoom out and show you the big picture those metrics describe. We'll explain what the halving actually is, why it matters, what the four phases of a cycle look like, and — crucially — where the data says we are in the current cycle right now.
Part 1The halving: Bitcoin's scheduled supply shock
When the Bitcoin network was launched in 2009, miners received 50 new BTC for every block they added to the chain. Roughly every 210,000 blocks — which works out to approximately four years — the reward is cut in half by the protocol. This event is called the halving (sometimes "halvening").
The schedule has run precisely on time:
- November 2012 — first halving: 50 → 25 BTC per block
- July 2016 — second halving: 25 → 12.5 BTC per block
- May 2020 — third halving: 12.5 → 6.25 BTC per block
- April 2024 — fourth halving: 6.25 → 3.125 BTC per block
The halving is hard-coded into Bitcoin's protocol. It cannot be changed by any single actor, government, or company. When the reward halves, the number of new bitcoins flowing to miners every day drops by 50% overnight. Before the 2024 halving, roughly 900 new BTC were minted per day. Afterward, that dropped to around 450. The total supply of Bitcoin is capped at 21 million coins, and the halving schedule is the mechanism that enforces that cap over time.
The supply-shock intuition
The standard story goes like this: if demand stays roughly the same but the new supply of coins coming to market is cut in half, the price should eventually rise to fill that gap. Miners, who now earn fewer coins for the same work, sell less into the market. New buyers still arrive. The gap between supply and demand tightens. Price rises.
Historically, a significant bull run has followed each of the four halvings, with price peaks occurring roughly 12–18 months after the event. That record — four for four — is hard to ignore.
Worth knowing
The supply-shock logic is compelling but not mechanical. Markets are forward-looking: the halving is known years in advance, so professional traders can (and do) price it in before it happens. The correlation between the halving and subsequent bull markets could reflect the supply shock, the coordinated narrative that surrounds the event, the broader macro cycle, or some mix of all three. Treat the halving as a strong structural tailwind, not a guaranteed price trigger.
Part 2The four phases of a Bitcoin cycle
Step back from any individual halving and you see a repeating four-phase structure. The names come from traditional market analysis — but the on-chain metrics you've already learned map onto each phase almost perfectly.
Phase 1 — Accumulation (the quiet bottom)
After a long bear market, price has bottomed and is grinding sideways. Most participants are either exhausted or have already sold. Volume is low. The news is relentlessly negative. But this is when patient buyers — especially long-term holders — are quietly picking up coins from sellers who have given up.
On-chain fingerprints: MVRV falls below 1 (the average holder is at a loss); NUPL turns negative (the market is in "capitulation" or "despair"); SOPR dips below 1 persistently as sellers accept losses; LTH supply grows as coins age and transfer to steadier hands.
Phase 2 — Markup (the bull run)
Sentiment flips. Price starts to climb in earnest. New buyers arrive, FOMO builds, and each dip attracts more buyers than the last. This phase can last 12–24 months and usually catches up with (and far exceeds) the previous all-time high.
On-chain fingerprints: MVRV rises above 1 and climbs steadily; NUPL moves from "hope" through "optimism" toward "belief"; SOPR consistently above 1 as coins move for profit; LTH supply begins to fall as long-term holders distribute into strength.
Phase 3 — Euphoria and distribution (the top)
Price is at or near its peak. Media coverage is everywhere. Every conversation includes someone who got rich. This is also when the most experienced holders are selling — distributing their coins to the most recent (and excited) buyers. It rarely feels obvious in real time.
On-chain fingerprints: MVRV climbs above 3.5 (the market is far above cost basis — a historically extreme level); NUPL exceeds 0.75 (greed/euphoria territory); realized profit flows are at their highest, meaning coins are changing hands at huge gains; STH supply surges as fresh buyers absorb the distribution.
Phase 4 — Markdown (the bear market)
The music stops. Buyers dry up. Price falls — often sharply and for longer than anyone expects. This phase ends only when selling exhaustion sets in and we're back to Phase 1 territory.
On-chain fingerprints: MVRV declines from elevated levels back toward 1, sometimes briefly below; NUPL retreats through "anxiety" and "fear" to "capitulation"; SOPR dips below 1 as late buyers sell at a loss; realized losses spike; LTH supply eventually builds again as coins age in place.
Key idea
The halving sets the rhythm — it determines roughly when new supply pressure eases. But the on-chain cost-basis metrics are the clock inside that rhythm: MVRV, NUPL, and SOPR tell you whether you're in accumulation, markup, euphoria, or markdown, regardless of what date it is. The halving is the calendar. The metrics are the hands on the clock.
Part 3The historical record: four cycle tops
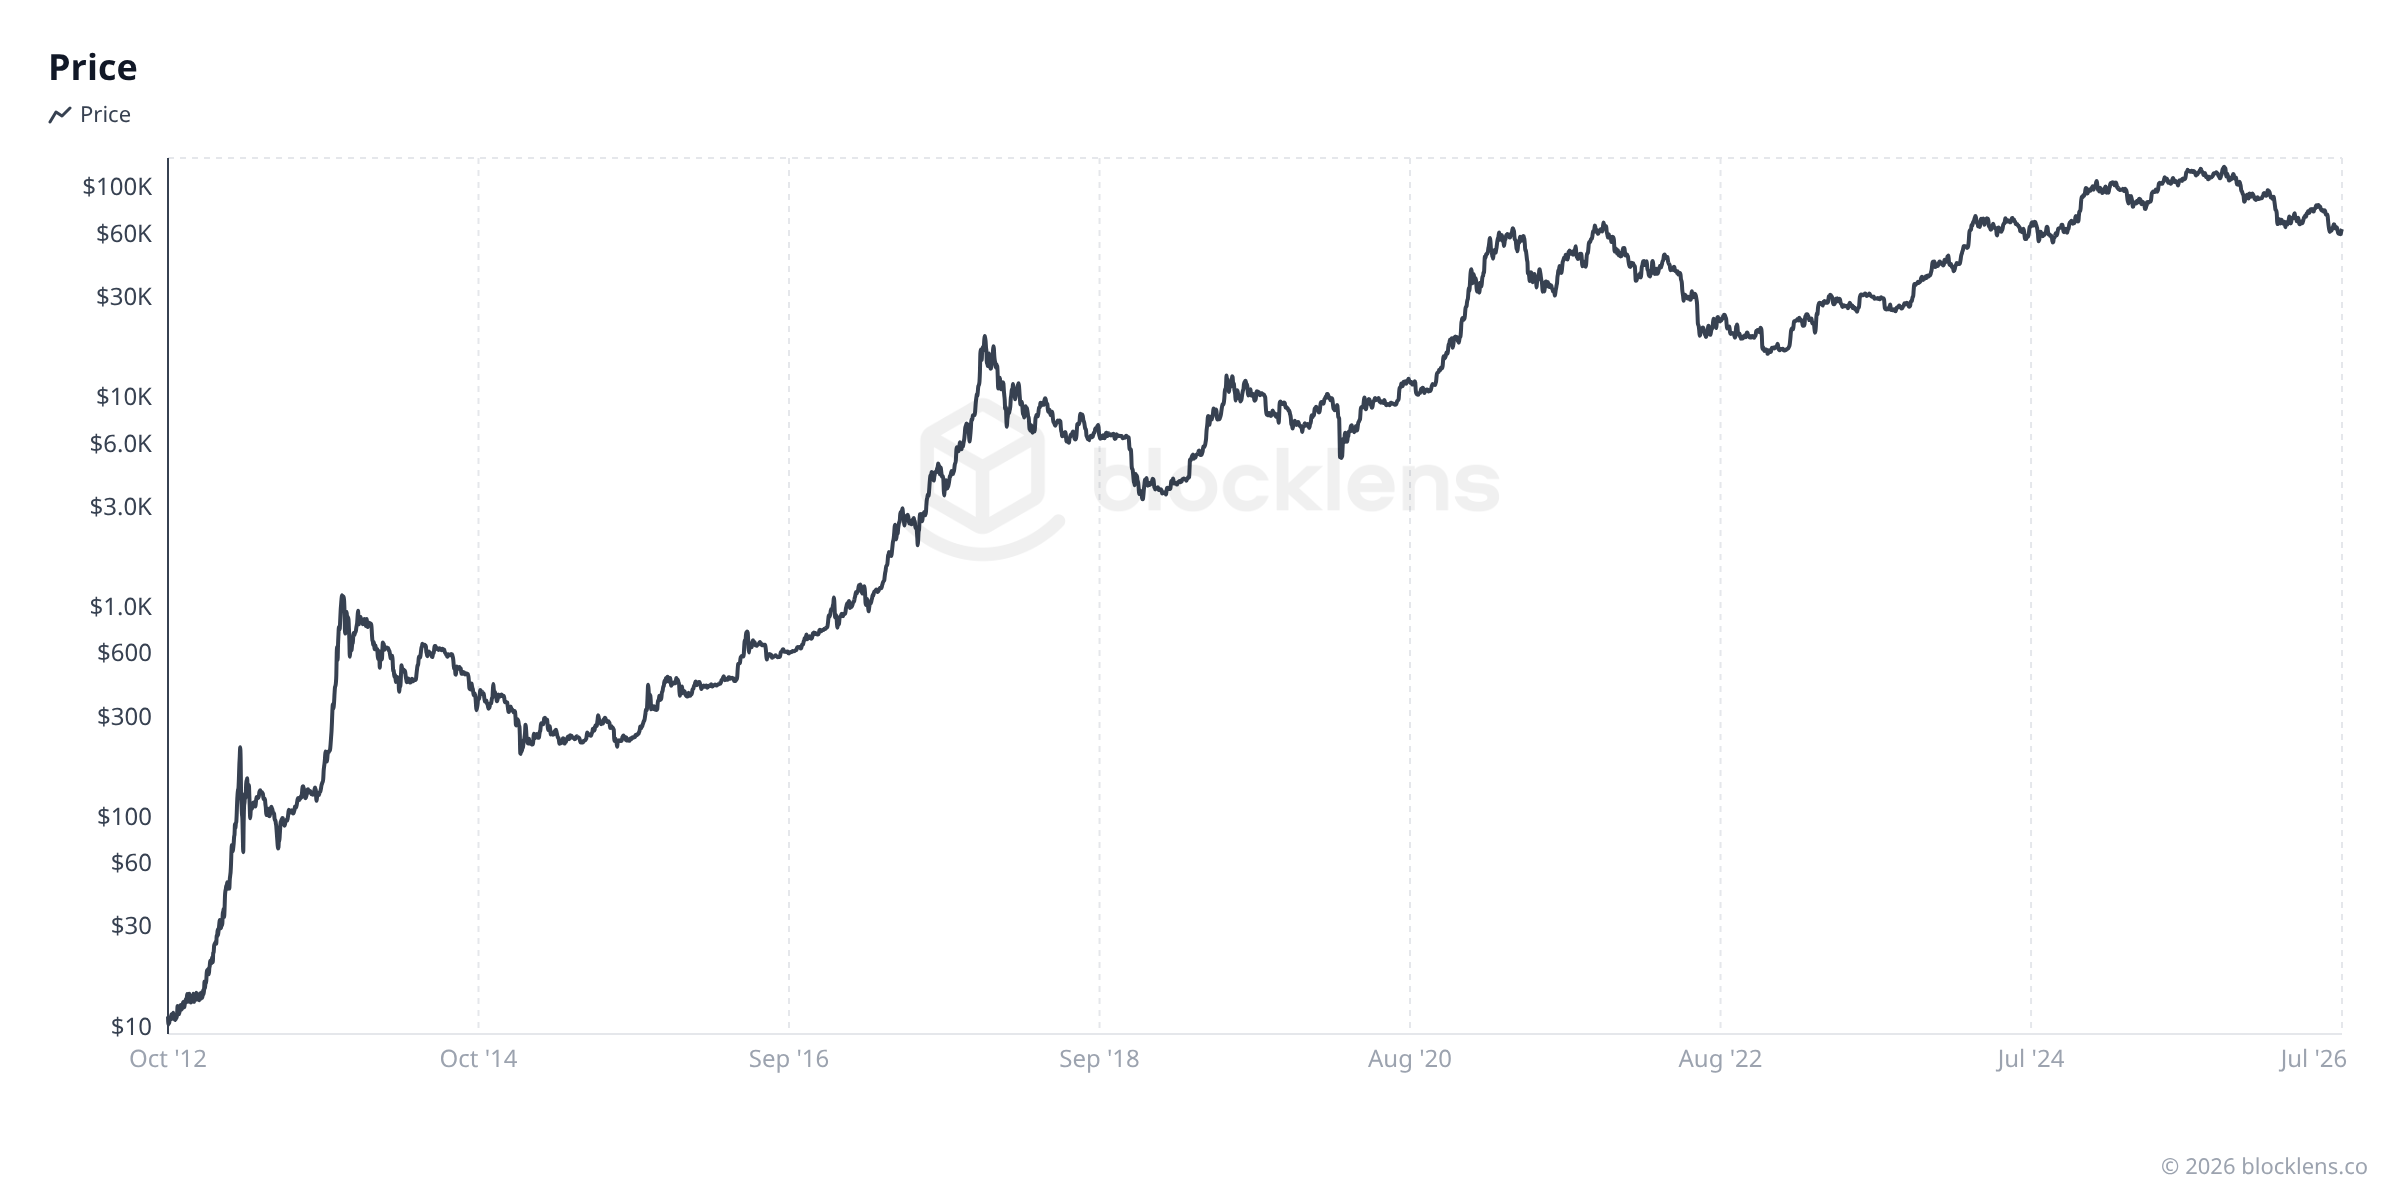
Blocklens tracks Bitcoin cycle boundaries from on-chain data going back to the very first cycle. Here is the record of each cycle's peak price and the typical depth of the bear market that followed it.
| Cycle | Peak price | Peak date | Subsequent bear drawdown |
|---|---|---|---|
| 2011–2013 | $1,156 | Nov 2013 | ≈ −85% to the trough |
| 2013–2017 | $20,089 | Dec 2017 | ≈ −84% to the trough |
| 2017–2021 | $68,790 | Nov 2021 | ≈ −77% to the trough |
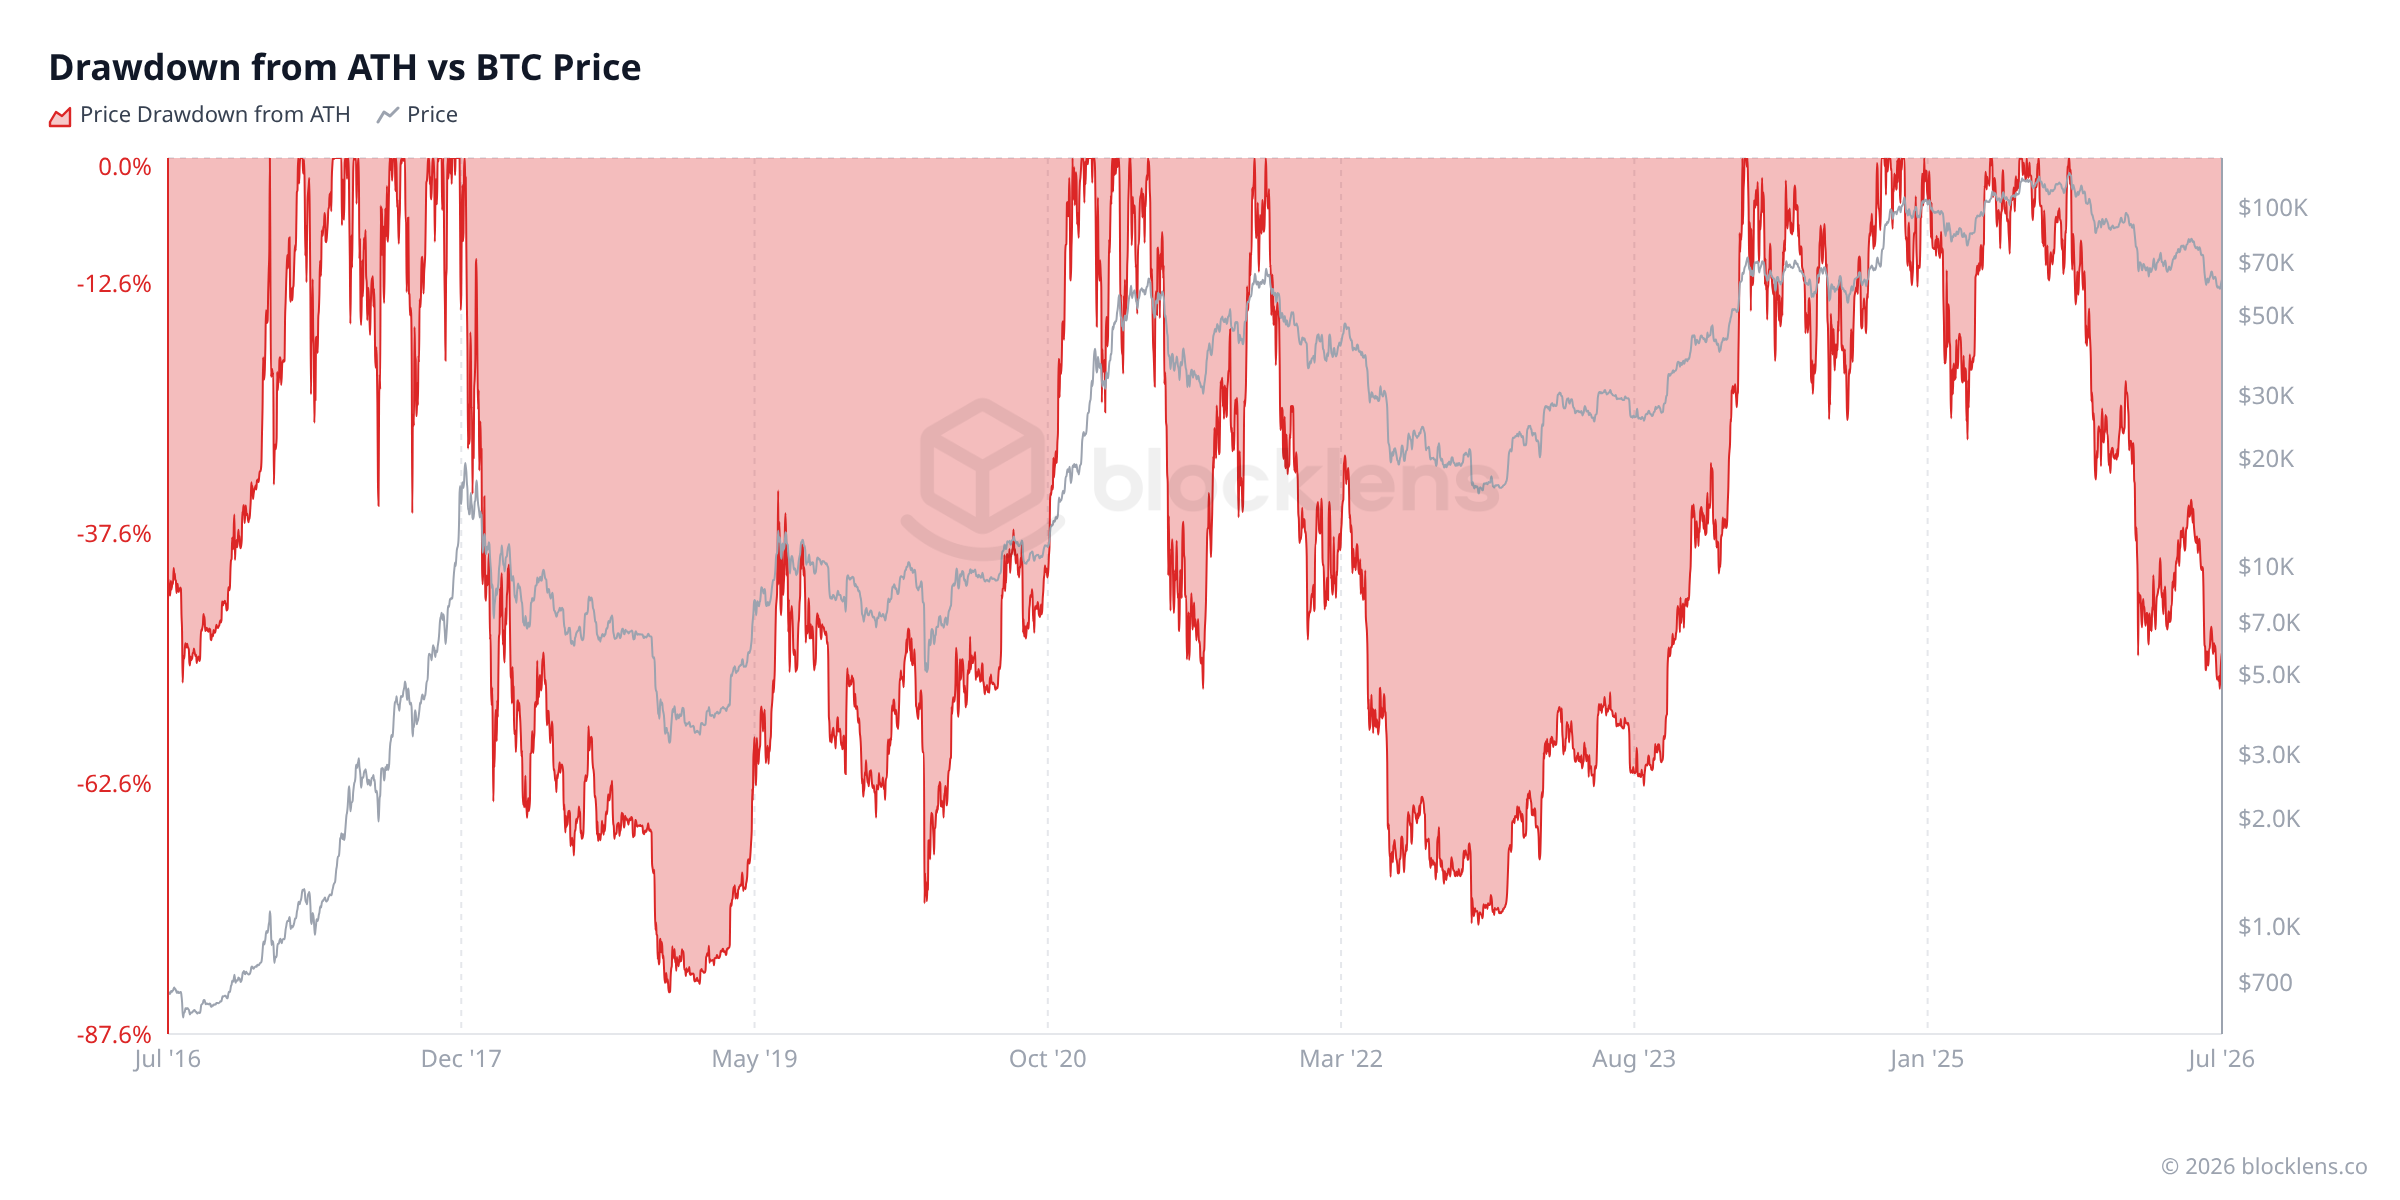
| 2021–2025 | $126,198 | Oct 2025 | ≈ −54% so far (cycle ongoing) |
A few things stand out in that table. First, each cycle's peak has been dramatically higher in absolute dollars than the last. Second — and this is the sobering part — each bear market that followed erased roughly 75–85% of the gains from the top. Third, percentage gains have diminished each cycle: going from under $1,000 to $20,089 in one cycle is a very different mathematical feat than going from $68,790 to $126,198.
The implication is that Bitcoin's growth is real but decelerating. As the market matures and more capital is involved, the explosive percentage moves of early cycles become structurally harder to repeat.
Overlaying the cyclesSame starting line, four races
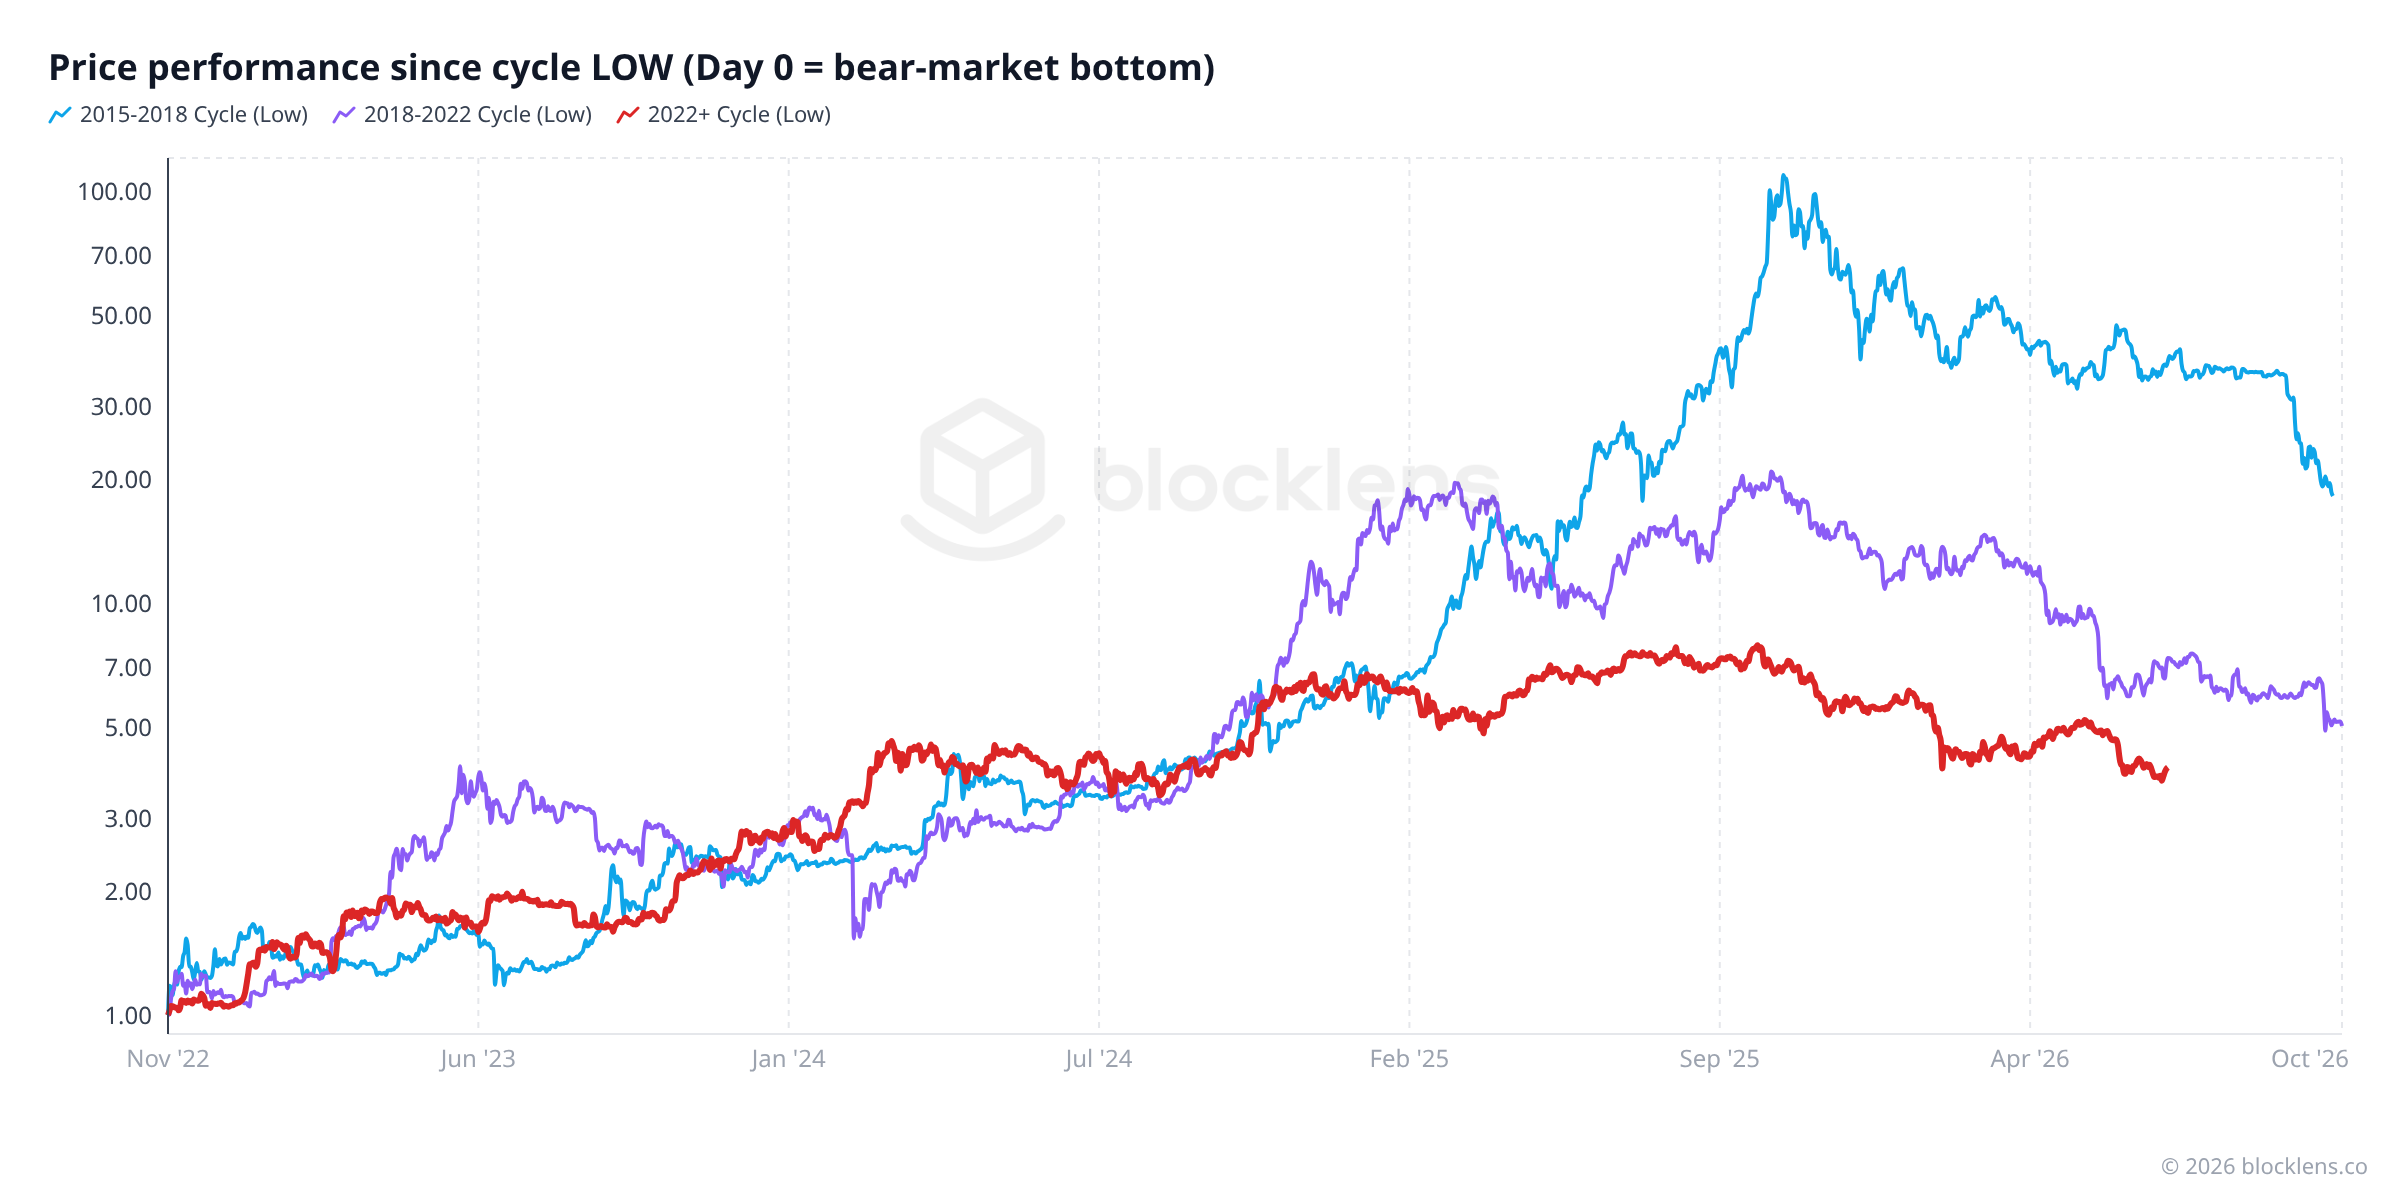
Absolute dollar charts hide the one thing that makes cycles comparable: their shape. The fix is simple — re-index every cycle to 1.0 at a common starting event (the all-time high, or the bear-market bottom) and plot them against days elapsed instead of calendar dates. Suddenly all the cycles run on the same track, and you can see exactly where the current one sits relative to its ancestors.
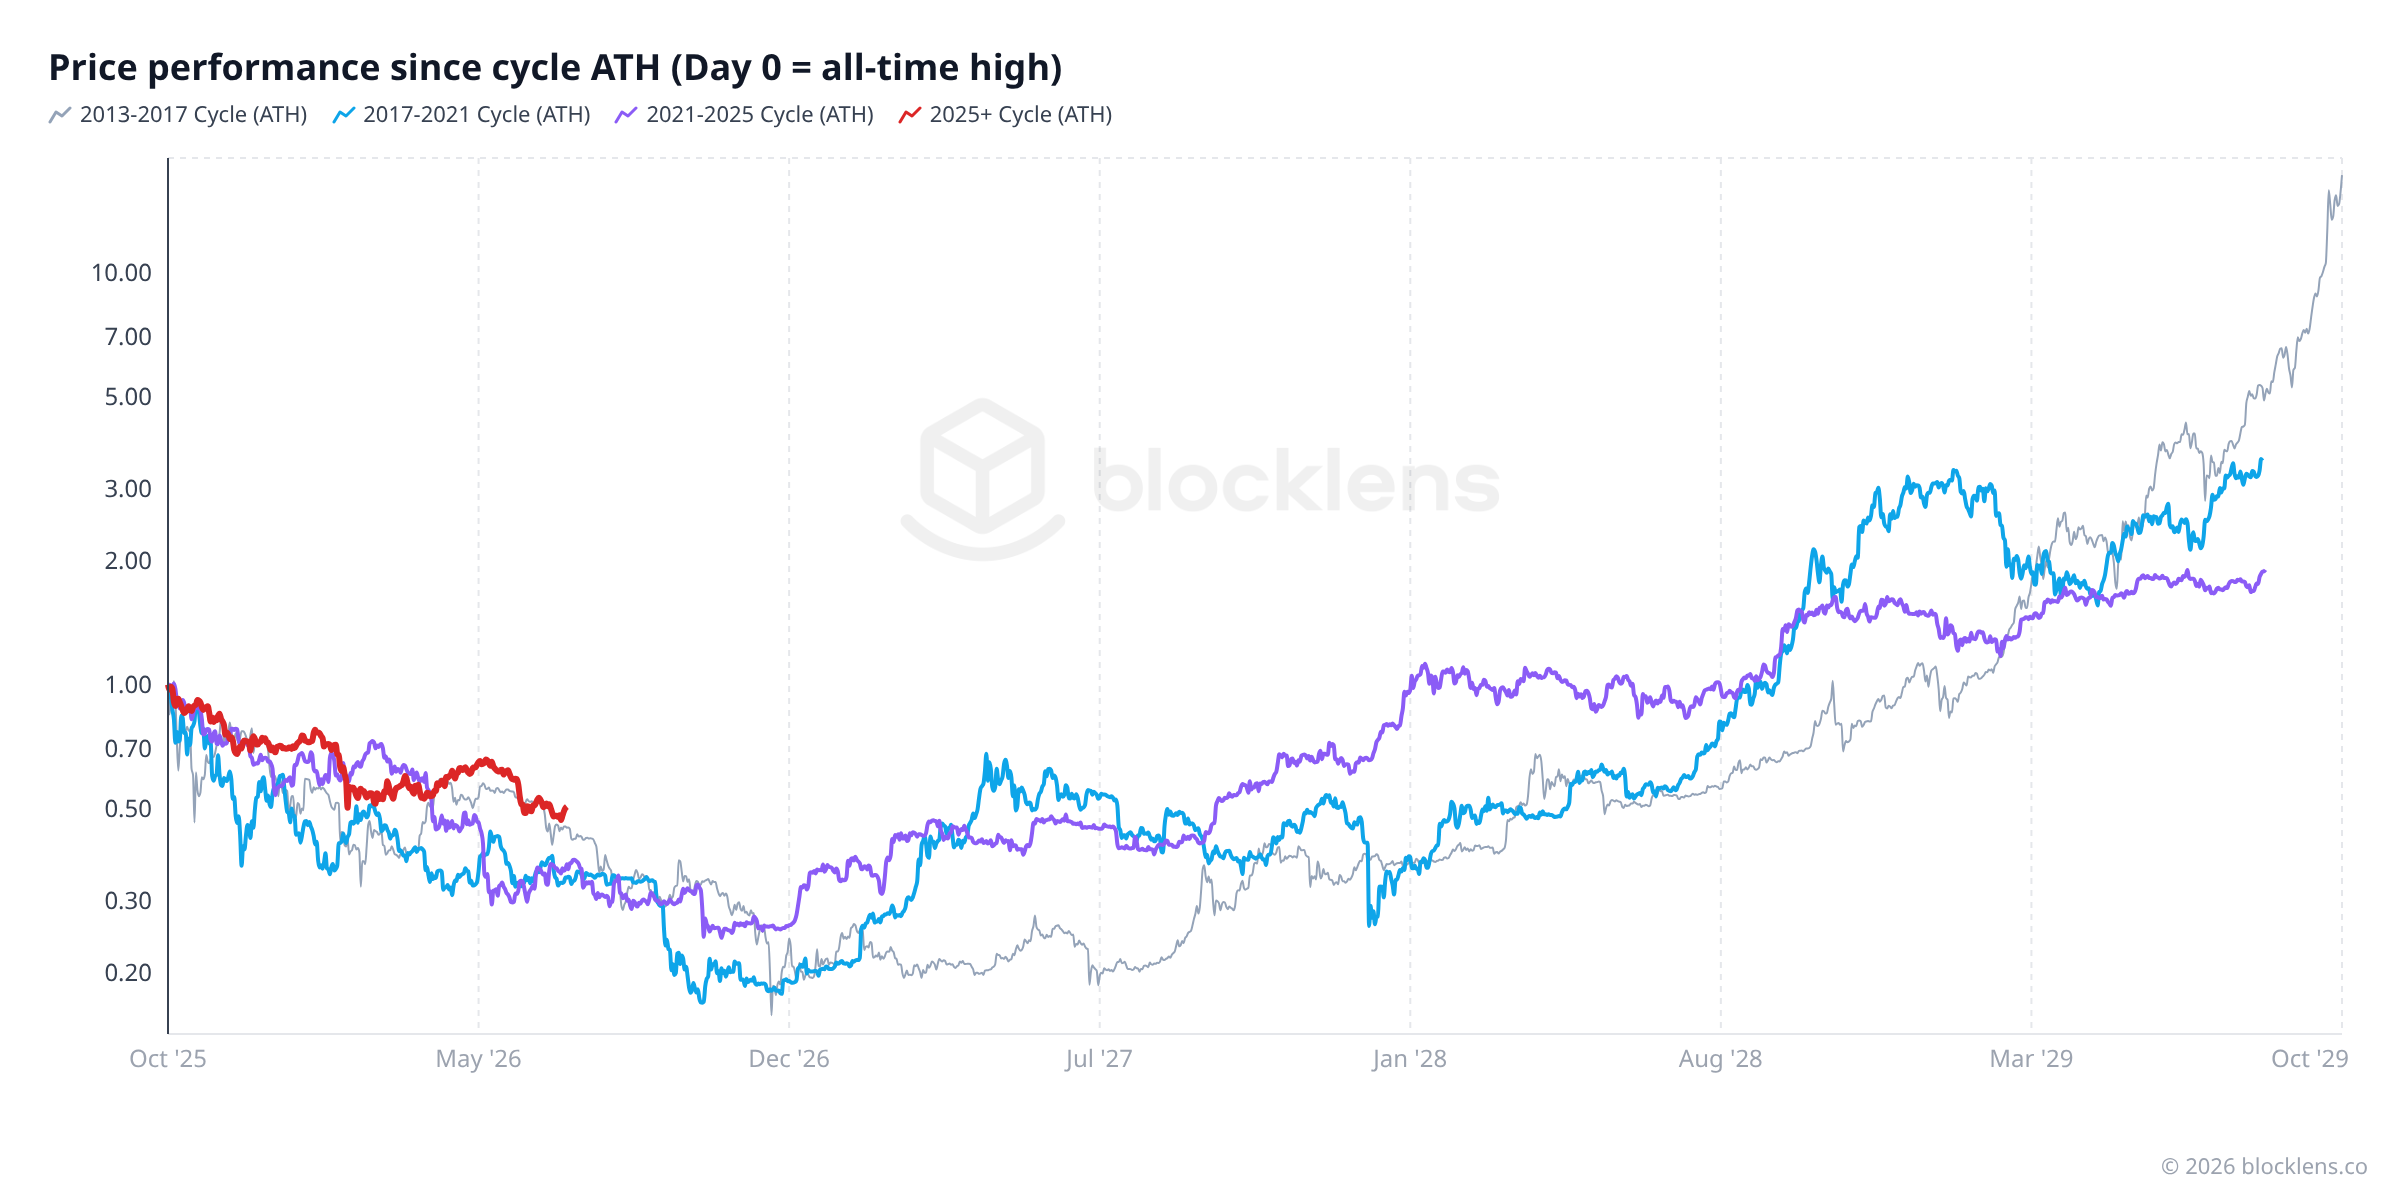
Freeze the comparison at the current cycle's age — day 271 from the top — and put the four cycles side by side:
| Cycle | Drawdown at day 271 | Eventual trough | Trough day |
|---|---|---|---|
| 2013 → 2015 | −55% | −83% | 411 |
| 2017 → 2018 | −65% | −83% | 364 |
| 2021 → 2022 | −65% | −76% | 379 |
| 2025 → now | −49% | ? | ? |
Three observations fall out of this overlay:
- The shape repeats. The day-by-day correlation between the current cycle's path and the three previous ones runs 0.73–0.81 — the same grinding stair-step decline, punctuated by failed rallies.
- This cycle is running shallower. At the same age, previous bears were 5–16 percentage points deeper underwater. The ETF-era institutional bid (see the aside below) is the leading suspect.
- The template has a calendar. All three completed bears bottomed between day 364 and day 411 after the top. On the current cycle's clock, that window is roughly October–November 2026. Treat this as a historical rhyme, not a schedule — three data points do not make a law. But note how neatly it complements Part 2 of this series: the LTH cost basis tells you the price zone where bottoms form; the overlay template tells you the historical time window. Two independent lenses, one picture.
Part 4Cycle 5 — where we are right now
The current cycle — call it Cycle 5 — began when the previous cycle peaked at $126,198 (daily high) on 6 October 2025. That all-time high marked the top of the markup phase and the beginning of the markdown that followed.
As of 4 July 2026, roughly nine months into the post-peak period:
- The lowest point reached so far was $57,748 (daily low) on 1 July 2026, day ~268 of the cycle.
- That is a drawdown of approximately −54% from the October 2025 all-time high.
- Price today sits around $62,830 — the first bounce off that fresh low.
Fifty-four percent is a meaningful drop. But look at the table above: the previous three cycles all produced bear-market floors of −77% to −85%. If the current cycle were to follow that template, price would have a great deal further to fall from here. But if the pattern is weakening — as it appears to be — this might be a shallower correction than those that came before.
Worth knowing
The "four-year template" is a pattern, not a guarantee. One structural development makes this cycle genuinely different from all prior ones: the January 2024 approval of US spot Bitcoin ETFs brought a wave of institutional capital — pension funds, wealth managers, corporate treasuries — into the market through familiar, regulated products. These buyers don't behave like retail speculators. They tend to buy steadily, hold longer, and are less likely to capitulate at the first sign of volatility. That may help explain why the current bear-market drawdown (≈ −54%) is noticeably milder than the >75% crashes of past cycles. Patterns can break. Treat the cycle framework as a useful lens for context — not a prophecy for what comes next.
The policy clockElections, regulators, and the same four years
The halving is not the only thing that runs on a four-year schedule. Since 2012, every halving has landed in a US presidential-election year — 2012, 2016, 2020, 2024, and (on current block pace) 2028. That is a quirk of arithmetic, not design: halvings arrive slightly faster than every four years, so the date creeps earlier within each election year (November 2012 → July 2016 → May 2020 → April 2024). But the consequence is real: every post-halving mania year is also the first year of a new US administration, and every historical bear-market bottom has landed within weeks of a US midterm election (January 2015, December 2018, November 2022).
Overlay the regulatory record on the price history and the interplay becomes visible:
The table below unpacks those dots. Two patterns are worth carrying away. First, through 2021 the big regulatory moves were mostly reactions to price manias — China's three crackdowns (2013, 2017, 2021) each landed in a post-halving bull year, as did the SEC's ICO campaign. Second, the 2024–2026 wave is different in kind: crypto became a funded, explicit campaign issue in the 2024 US election, and the resulting policy turn (ETFs → strategic reserve → stablecoin law → market-structure law) has been driven by the political calendar rather than by price. The four-year rhythm now has two engines instead of one.
| Date | Where | What happened | Direction |
|---|---|---|---|
| 2013-03 | US | FinCEN's first guidance: exchanges are money-services businesses | neutral |
| 2013-11 | US | Senate hearings call Bitcoin a "legitimate financial service" | permissive |
| 2013-12 | China | PBoC bars banks from Bitcoin business | restrictive |
| 2014-03 | US | IRS: crypto is property for tax purposes | neutral |
| 2015-06 | US | New York launches the BitLicense | restrictive |
| 2017-04 | Japan | Payment Services Act: crypto recognized as legal payment method | permissive |
| 2017-07 | US | SEC DAO Report: ICO tokens can be securities | restrictive |
| 2017-09 | China | ICO ban and domestic exchange shutdown | restrictive |
| 2017-12 | US | CBOE/CME bitcoin futures launch — the same week as the cycle top | permissive |
| 2018-04 | India | RBI bars banks from serving crypto businesses | restrictive |
| 2020-03 | India | Supreme Court strikes down the RBI ban | permissive |
| 2020-07 | US | OCC: national banks may custody crypto | permissive |
| 2021-05/09 | China | Mining ban, then a blanket ban on all crypto transactions | restrictive |
| 2021-09 | El Salvador | Bitcoin becomes legal tender | permissive |
| 2021-11 | US | Infrastructure Act broker rules — signed the week of the cycle top | restrictive |
| 2022-03 | Korea | President Yoon elected on explicit pro-crypto pledges | permissive |
| 2023-06 | US | SEC sues Coinbase and Binance | restrictive |
| 2023-06 | Hong Kong | Retail VASP licensing regime opens | permissive |
| 2024-01 | US | Spot Bitcoin ETFs approved | permissive |
| 2024-07 | US | Crypto becomes a funded 2024 campaign issue (Nashville pledge, super-PACs) | permissive |
| 2024-12 | EU | MiCA fully applies across the single market | neutral |
| 2025-03 | US | Strategic Bitcoin Reserve executive order | permissive |
| 2025-07 | US | GENIUS Act signed — federal stablecoin framework | permissive |
| 2026-03 | US | SEC + CFTC classify BTC, ETH and 14 other tokens as digital commodities | permissive |
| 2026-05 | US | CLARITY market-structure act clears Senate committee; floor vote targeted before the November midterms | permissive |
| 2026-06 | Japan | FIEA amendment: crypto reclassified as financial instruments, flat 20% tax | permissive |
Synchronization, not causation
Be careful with this pattern. Four cycles is a tiny sample; the halving and the US election calendar are locked together, so their effects cannot be cleanly separated; and global liquidity — which tends to ease into US election years — moves all risk assets at once. The honest claim is not "elections cause the Bitcoin cycle." It is that three four-year clocks — supply (the halving), policy (the US political calendar), and liquidity — have been running in phase since 2012, each reinforcing the rhythm the others set. The halving remains the engine; the policy clock has simply grown louder each cycle.
Part 5What the data says today
Let's be specific. Here is what the on-chain dashboard shows as of 4 July 2026 — the cycle-relevant metrics in plain English.
| Metric | Value | Plain-English meaning |
|---|---|---|
| Cycle start (ATH) | $126,198 | Oct 2025 all-time high (daily OHLC high); the cycle top |
| Cycle age | ≈ 9 months | Time elapsed since the cycle top |
| Cycle low so far | $57,748 | Daily OHLC low, reached 1 Jul 2026, day ~268 |
| Drawdown from ATH | ≈ −54% | High-to-low; shallower than past cycle bears (−77% to −85%) |
| Price today | ≈ $62,830 | Near the cycle low; not yet a confirmed bottom |
| MVRV | ≈ 1.19 | Market sits ~19% above its aggregate cost basis |
| NUPL | ≈ 0.16 | "Hope" zone — not capitulation, not euphoria |
Reading those numbers through the cycle lens: MVRV at 1.19 tells you the market is still modestly above its cost basis — not the deep-loss territory (MVRV below 1) that has historically marked genuine cycle bottoms. NUPL at 0.16 puts the market in the "hope" zone — past the worst of the fear, but nowhere near the greed that marks a top. Together, these metrics describe a market that is in a mid-cycle correction: down hard from the top, but not yet showing the on-chain signatures of full capitulation.
What would a bottom look like on-chain? Based on prior cycles: MVRV dipping below 1 (meaning the average holder is underwater), NUPL turning negative, and SOPR staying persistently below 1 as sellers accept losses. None of those conditions are present today — which is either a sign that the bottom is still ahead, or a sign that this cycle's bottom will be a milder affair than its predecessors. The data does not answer that question for you. It narrows the range of possibilities.
Putting it to workThe actionable takeaway
How to position within the cycle
Use the halving as the calendar and on-chain cost-basis metrics as the clock. Right now: roughly nine months past the October-2025 top, −54% drawdown, MVRV 1.19 / NUPL 0.16 — mid-cycle, not the capitulation signature (MVRV < 1, NUPL < 0, persistent SOPR < 1) that has marked prior bottoms. A bottom would announce itself when those flip; a top, when MVRV climbs back above 3.5 and NUPL above 0.75. The cycle-overlay template adds a calendar hint: the three completed bears all bottomed 364–411 days after their tops, which on this cycle's clock points to roughly October–November 2026 — a window that happens to coincide with the US midterms and the CLARITY vote.
Caveat: the four-year template is a lens, not a law — three completed cycles is a tiny sample, and the 2024 spot-ETF era has already bent the depth of the drawdown. Not financial advice.
Mini-glossary
- Halving
- The roughly-every-four-years event (every 210,000 blocks) in which Bitcoin's block reward to miners is cut in half. Reduces new supply flowing to market overnight.
- Market cycle
- The multi-year boom-bust wave that Bitcoin has historically followed: accumulation → markup (bull) → euphoria/distribution (top) → markdown (bear).
- Drawdown
- How far below its all-time high the price currently sits, expressed as a percentage. A −52% drawdown means price is 52% below its peak.
- All-time high (ATH)
- The highest price Bitcoin has ever reached. Each cycle has historically produced a new ATH before peaking.
- Accumulation
- The quiet phase at a cycle bottom where patient buyers steadily acquire coins from exhausted sellers — the foundation of the next bull run.
- Distribution
- The phase near a cycle top where experienced holders sell (distribute) their coins to new, excited buyers at elevated prices.
The On-Chain Basics series
- What on-chain analysis is — the cost-basis ledger
- Long-term vs. short-term holders (LTH / STH)
- MVRV in depth — reading "cheap vs. expensive"
- SOPR — what coins reveal the moment they're spent
- Realized profit & loss — capitulation and euphoria
- NUPL — the psychology of a market cycle
- Bitcoin's cycles — the halving and the four-year rhythm You are here
- The cost-basis "walls" — reading supply by price Next