On-Chain Basics
An 8-part guide to on-chain Bitcoin analysis — from first principles to cycle modeling
What On-Chain Analysis Actually Is
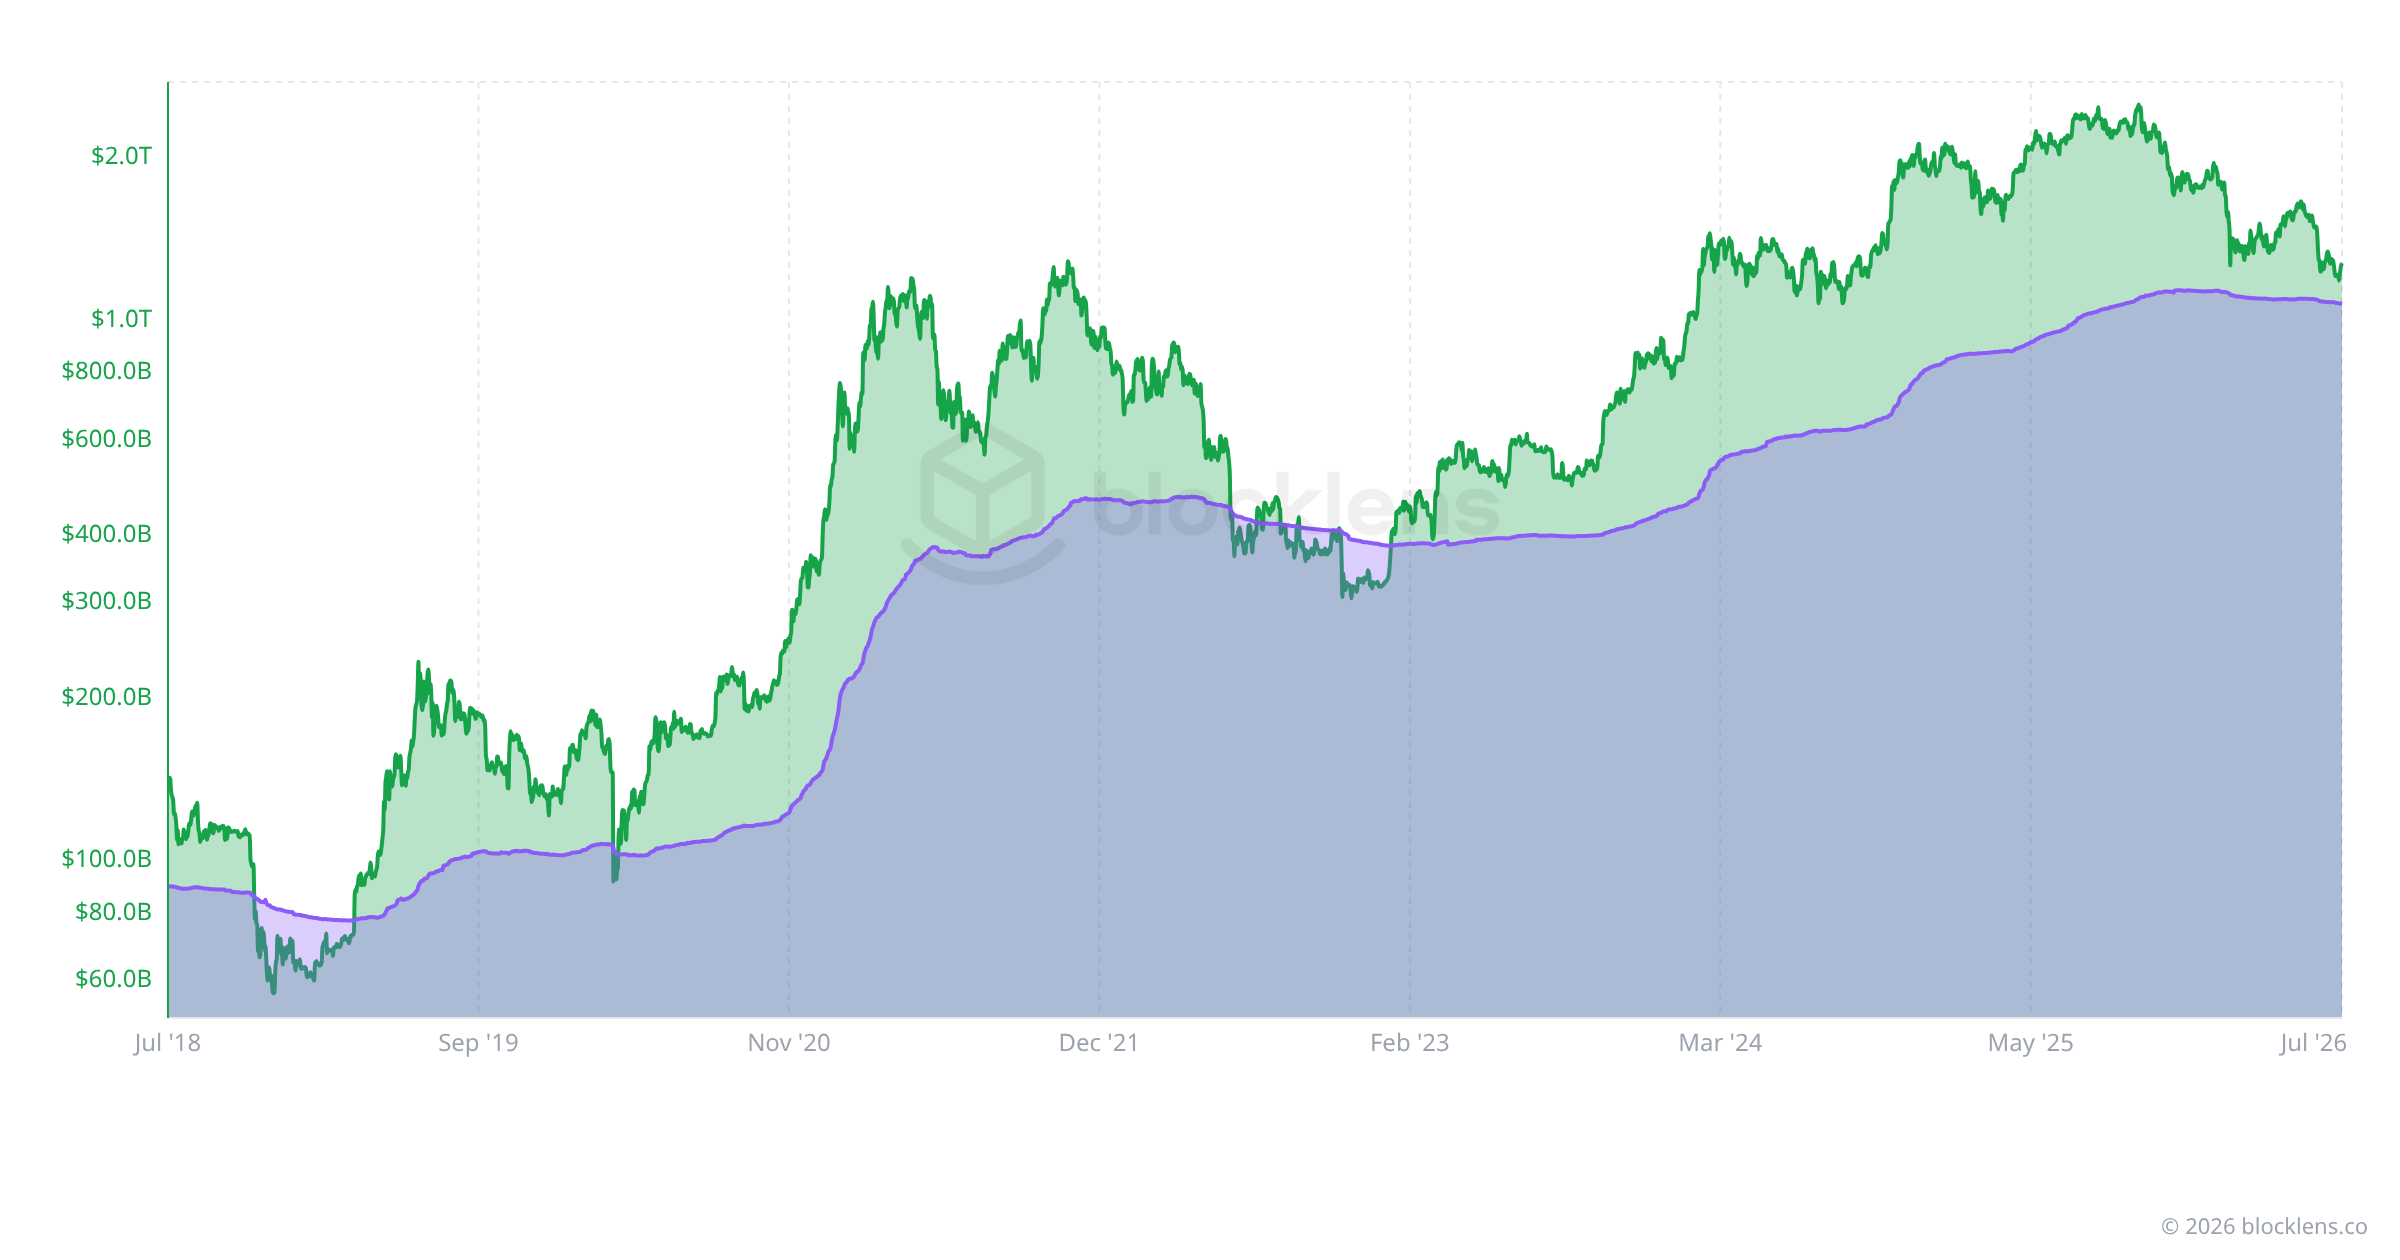
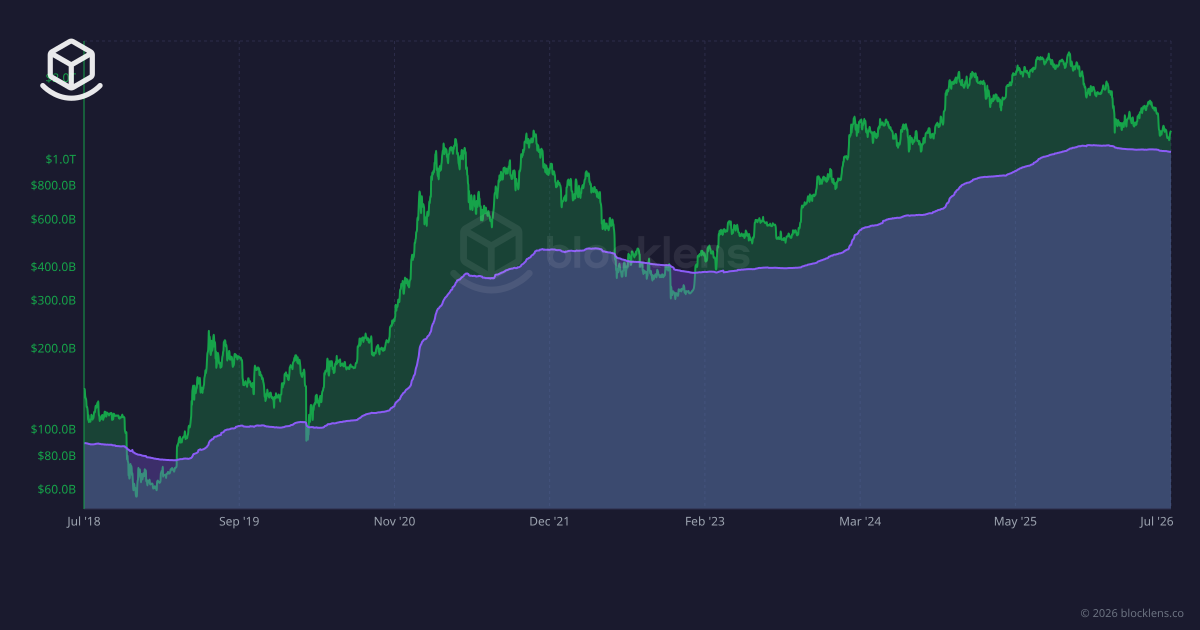
Every bitcoin records the price it last moved at. See how that one fact turns the blockchain into a public cost-basis ledger — the base of Realized Price & MVRV.
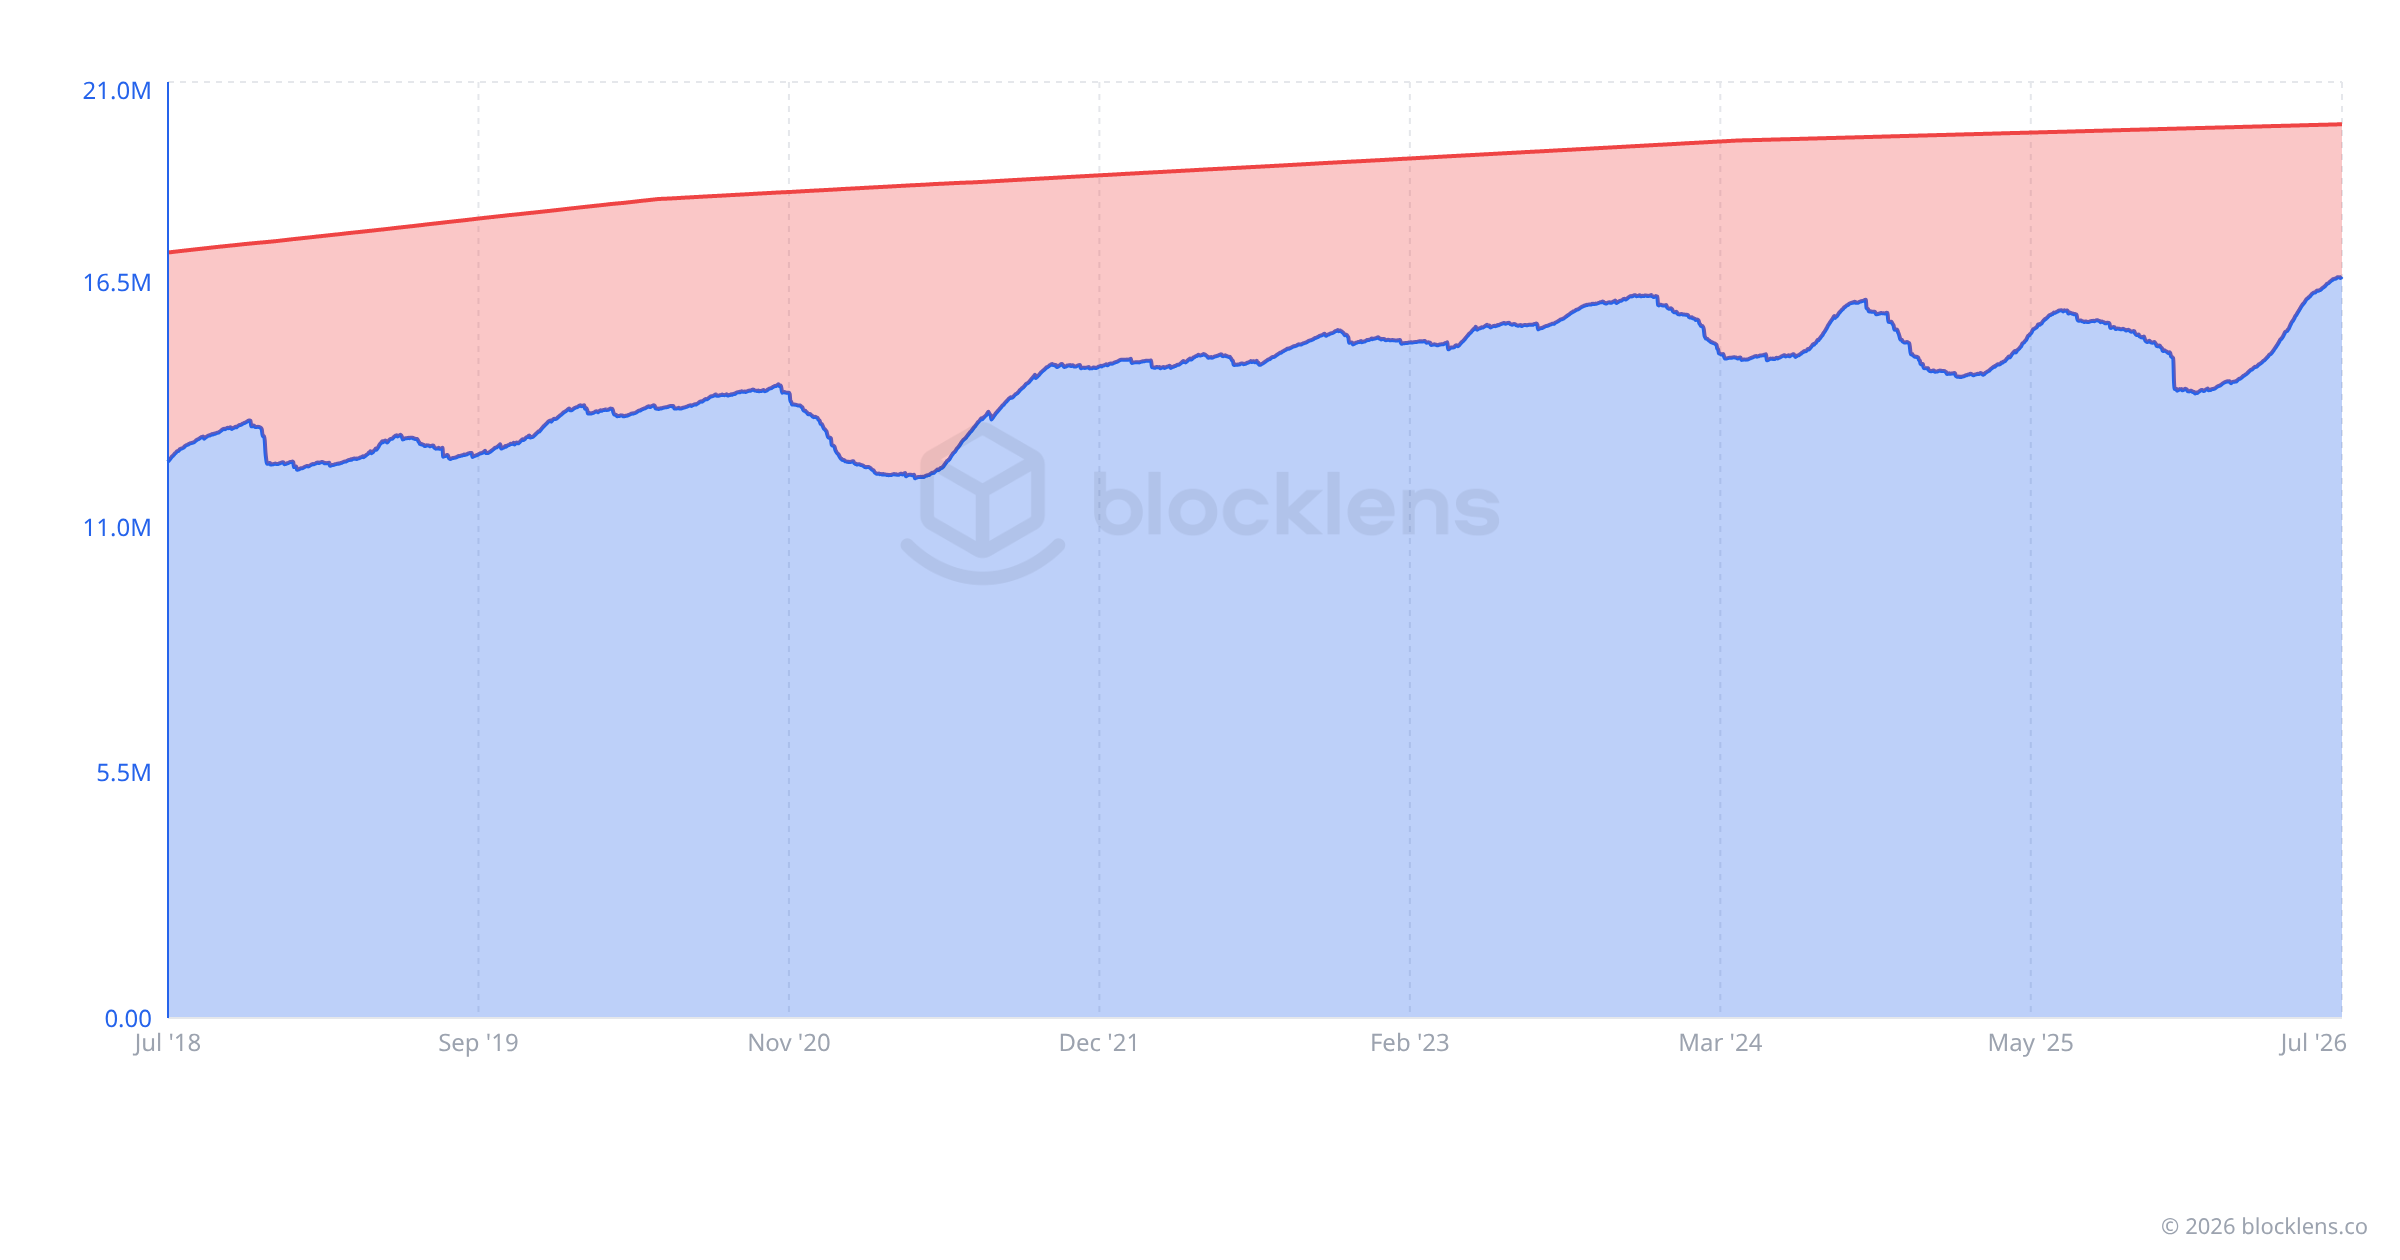
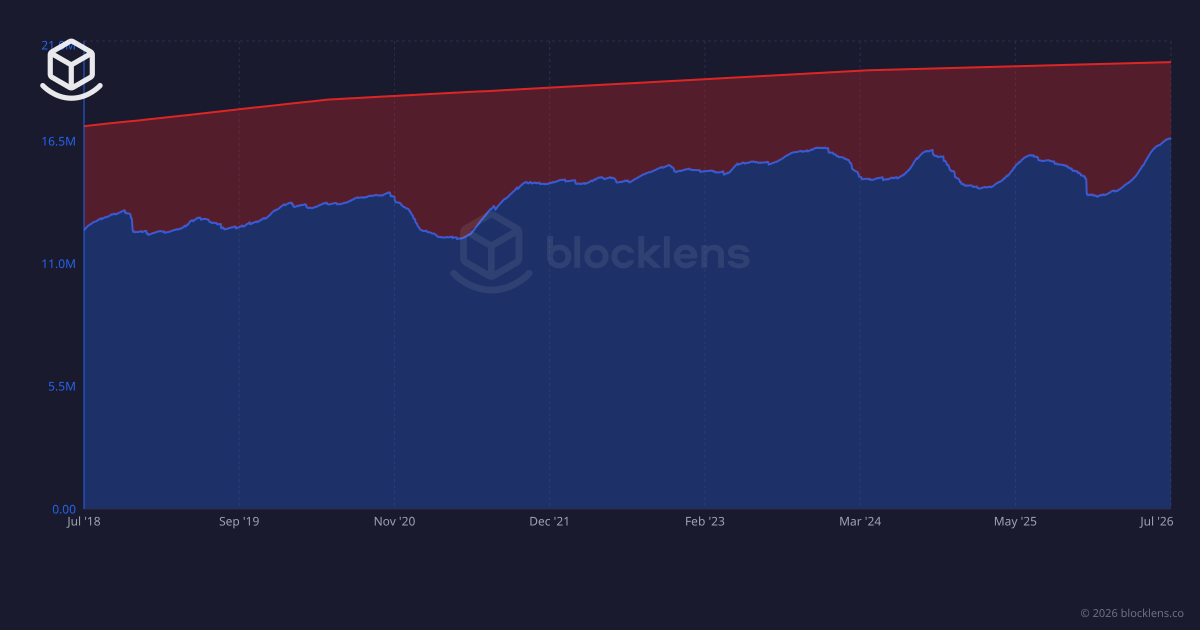
Long-Term vs Short-Term Holders
Split every bitcoin by how long it has sat still and the market's behavior suddenly makes sense. The 155-day line, LTH vs STH supply, and cohort cost basis explained.
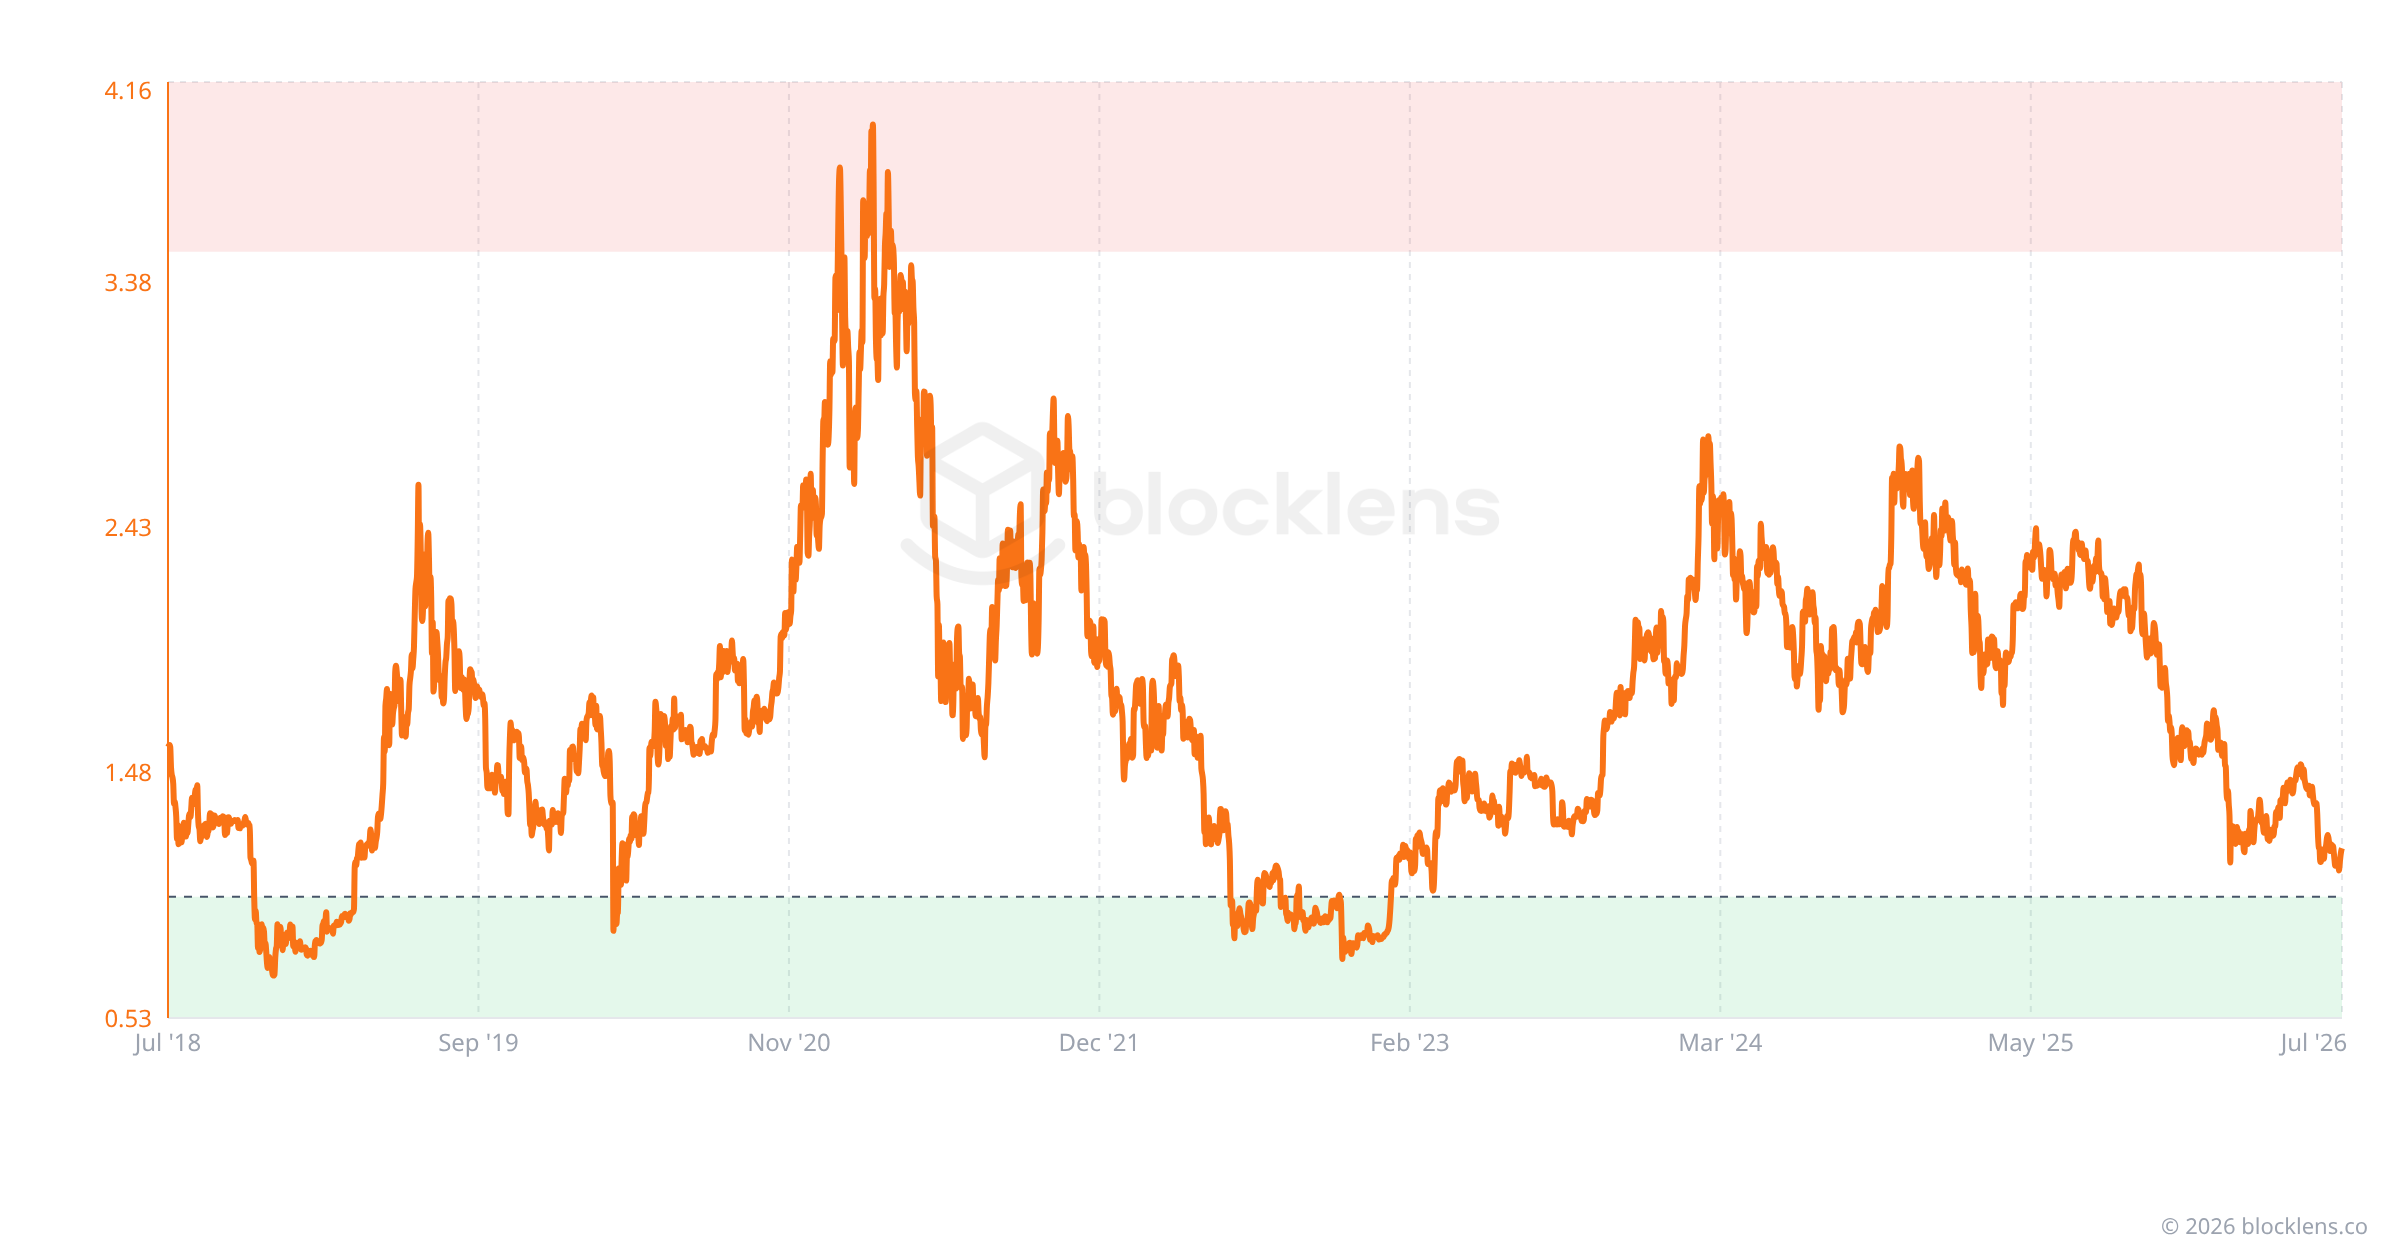
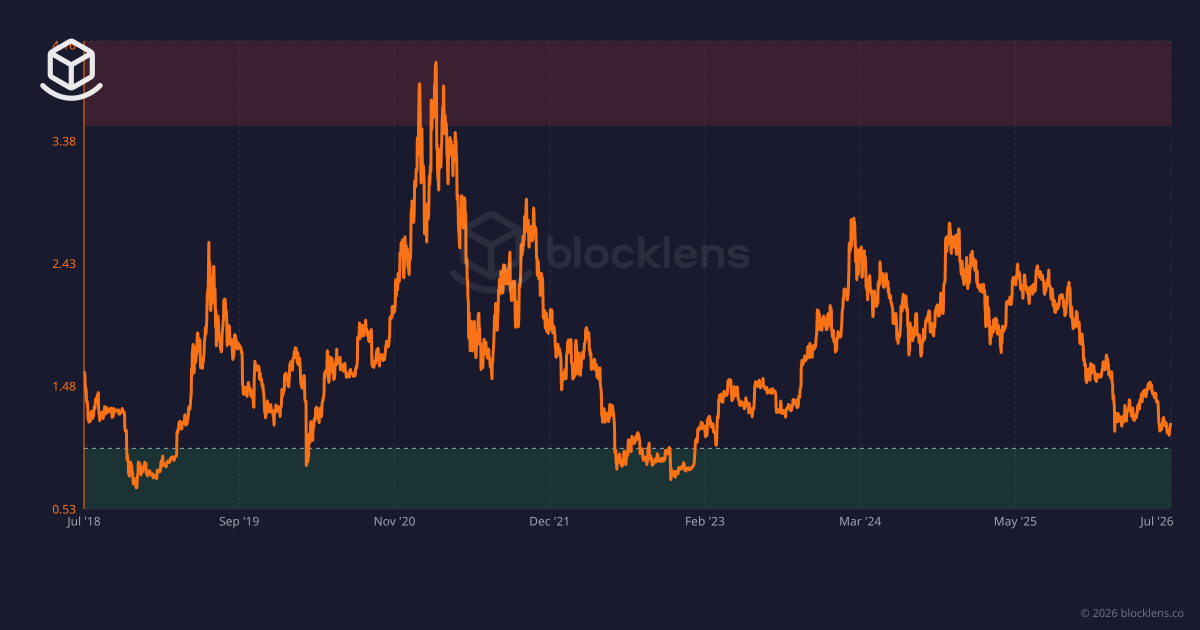
MVRV Explained
MVRV compares Bitcoin's market price to the network's average cost basis. Learn to read its cycle extremes — overheated tops, capitulation bottoms, and where we sit today.
SOPR Explained
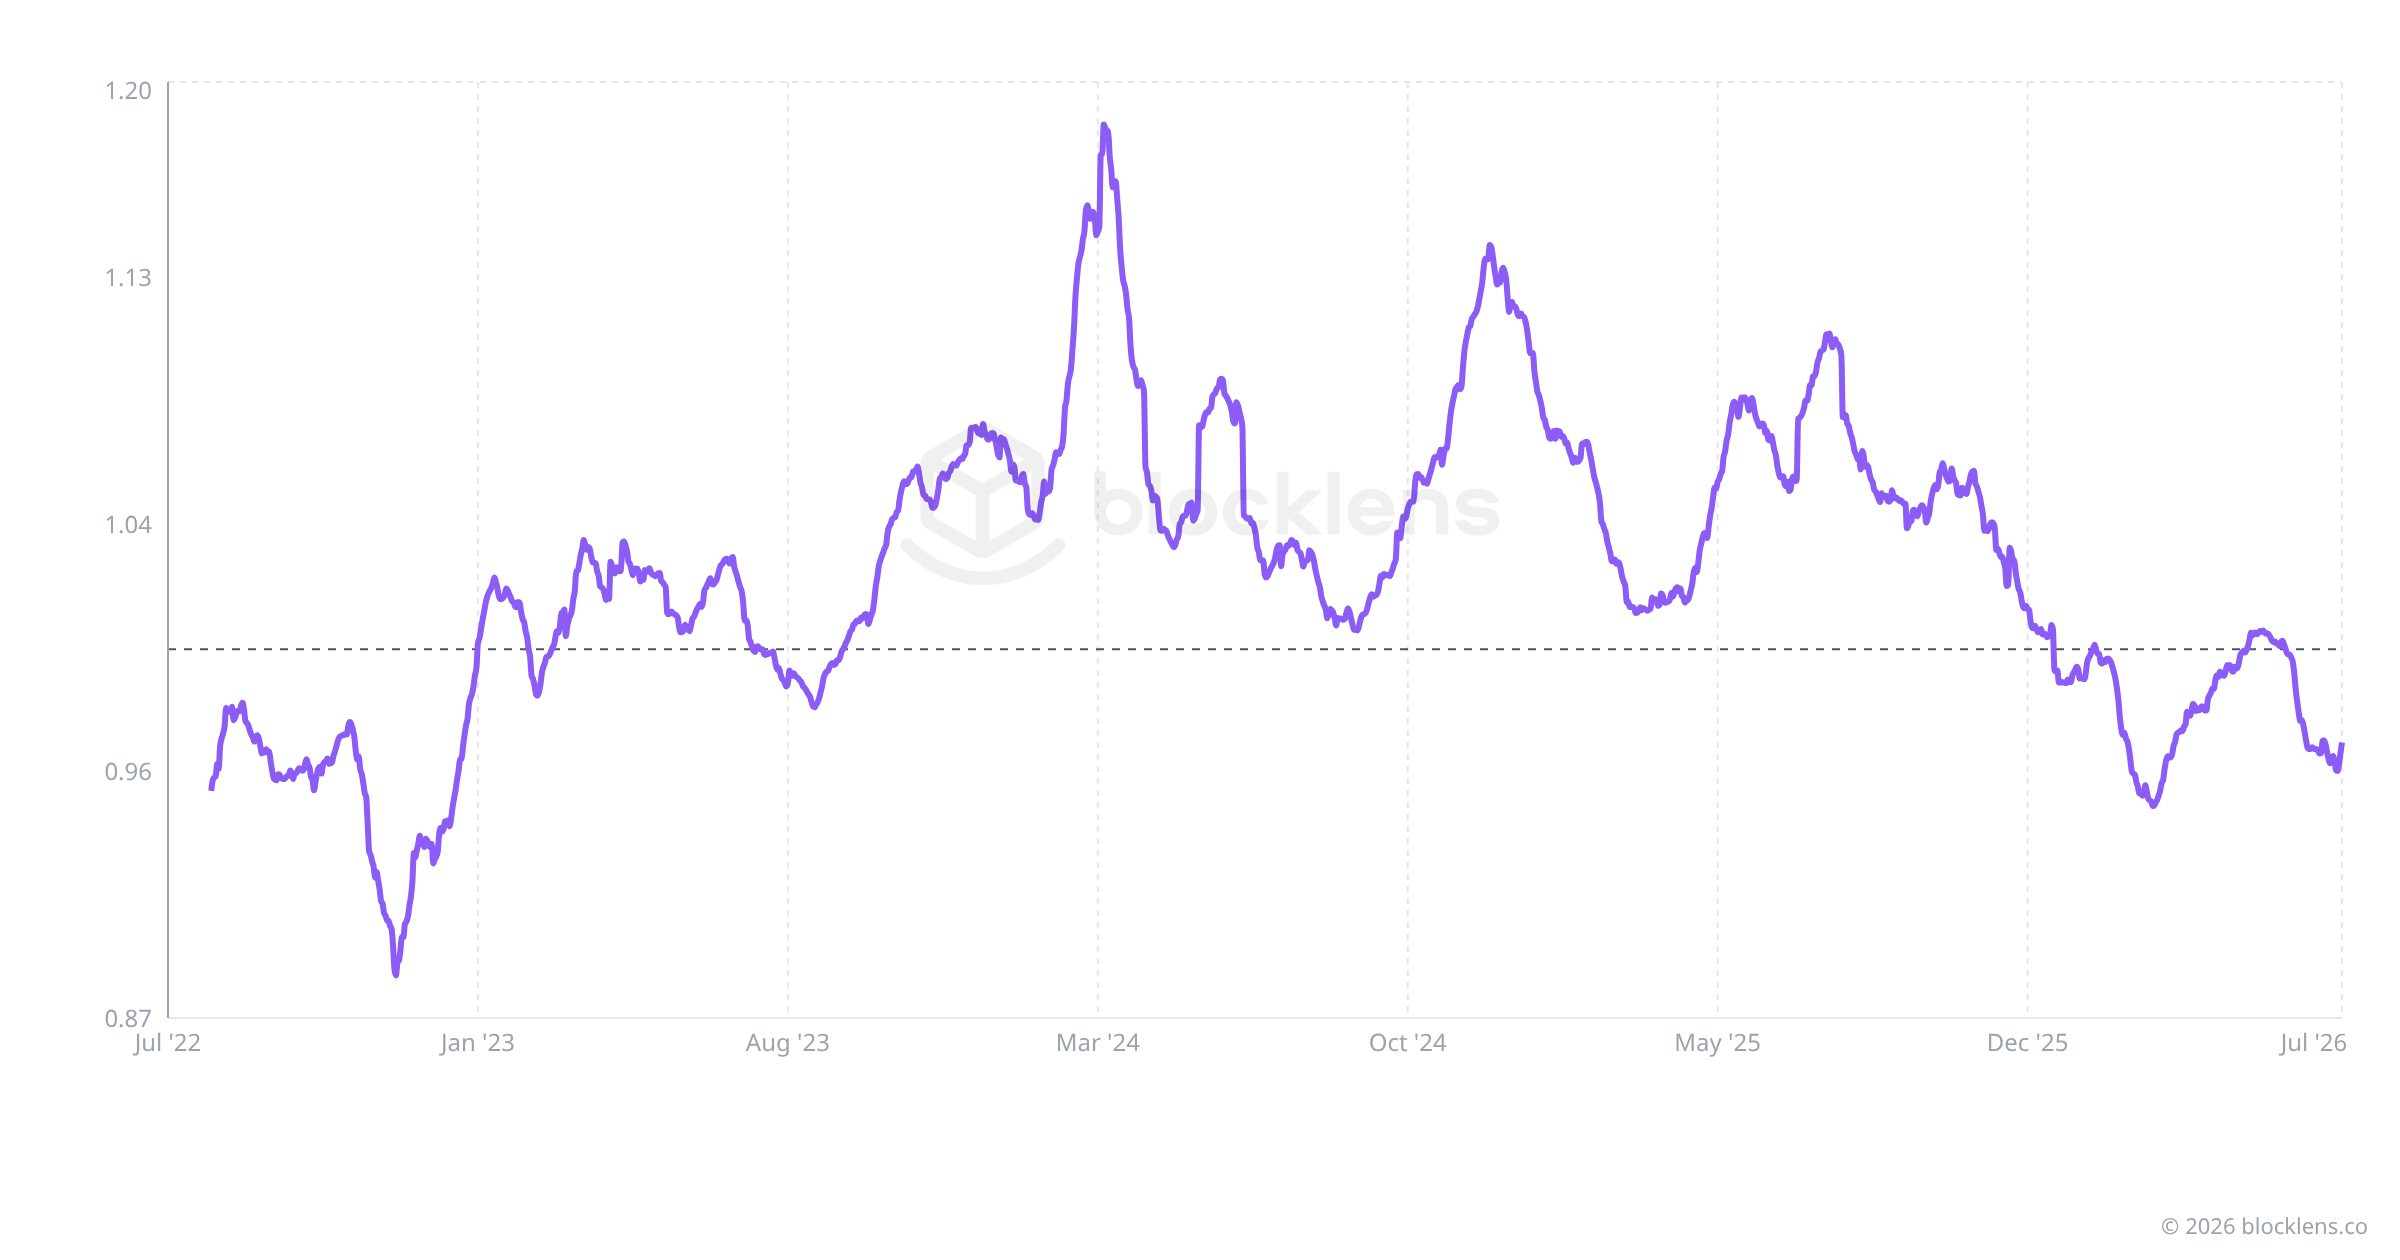
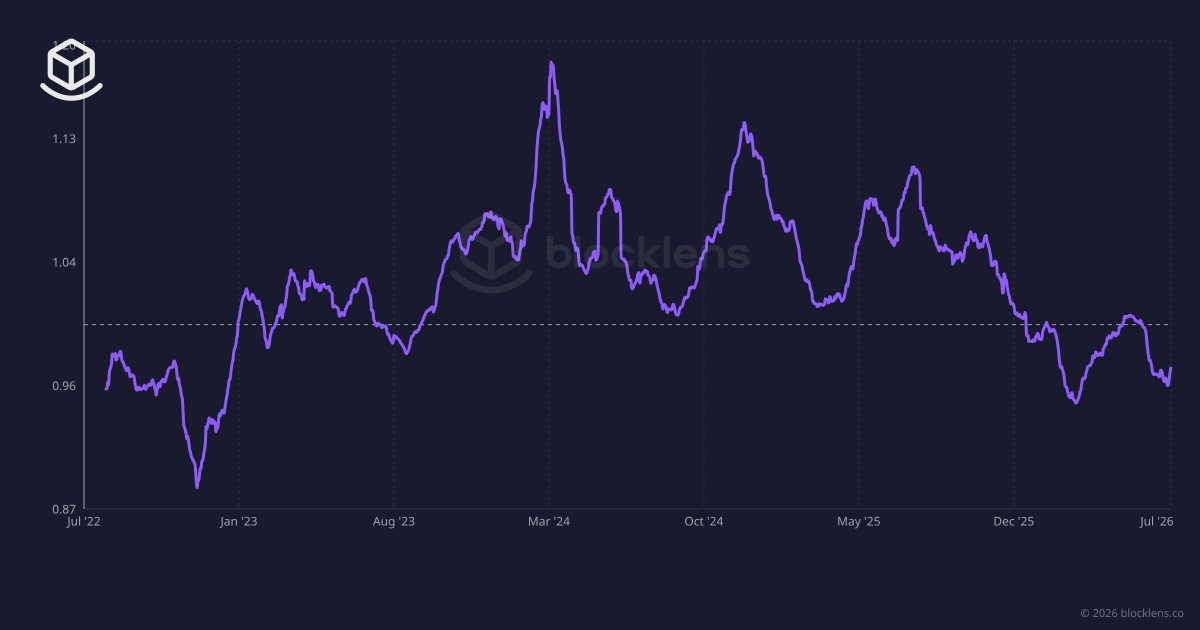
SOPR turns every on-chain spend into a profit-or-loss signal. Learn how the break-even line at 1 acts as support in bull markets and resistance in bear markets.
Realized Profit & Loss
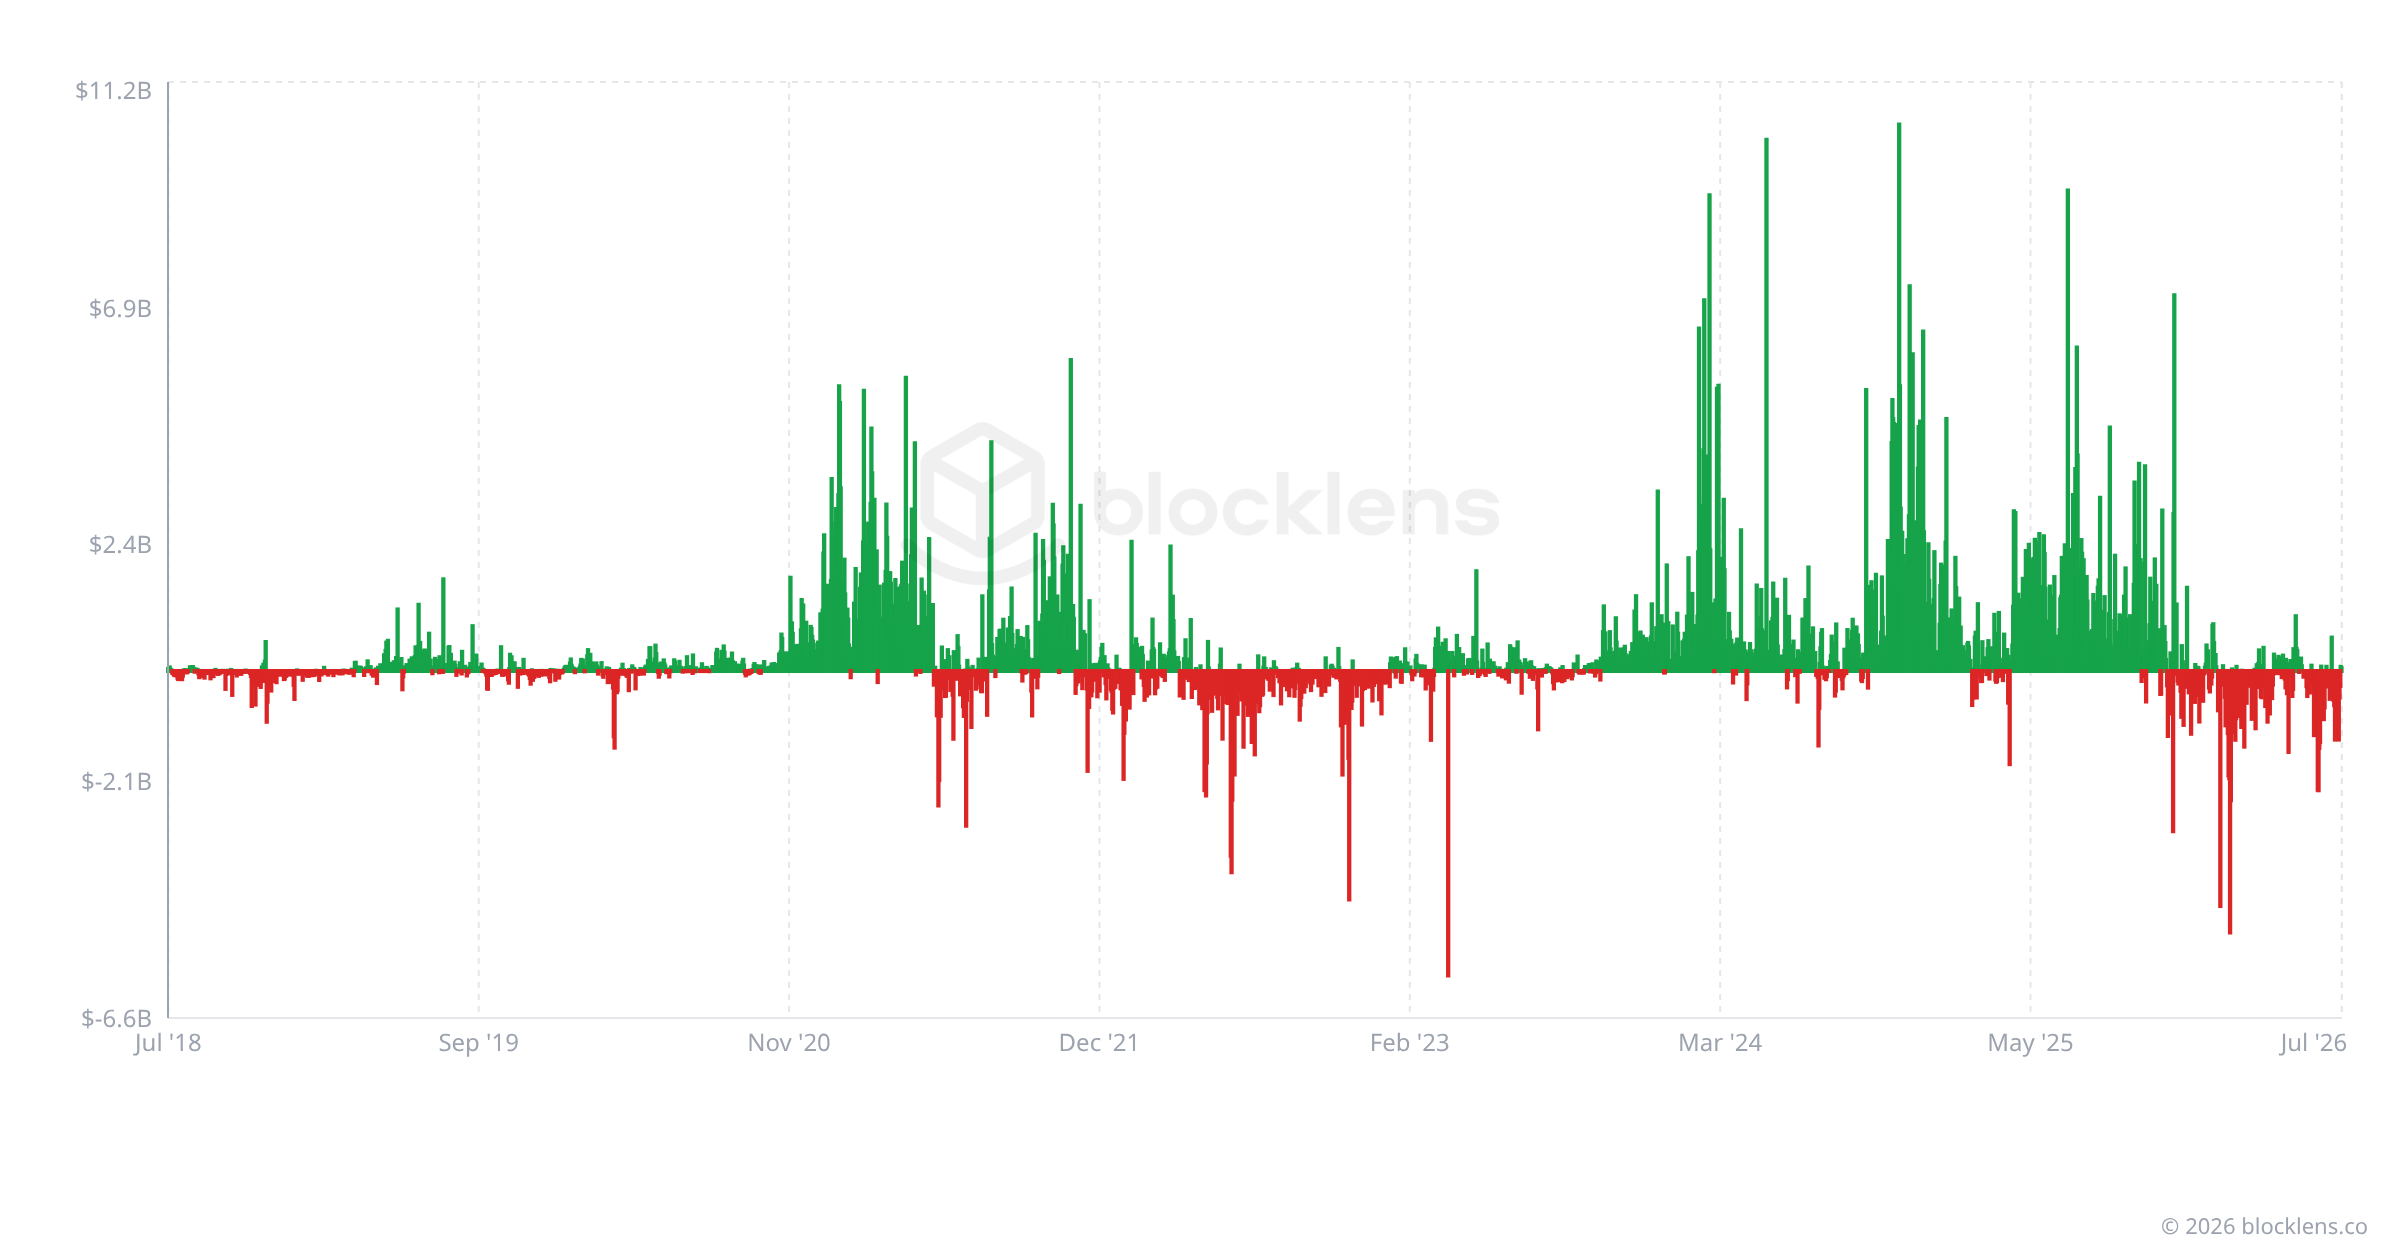
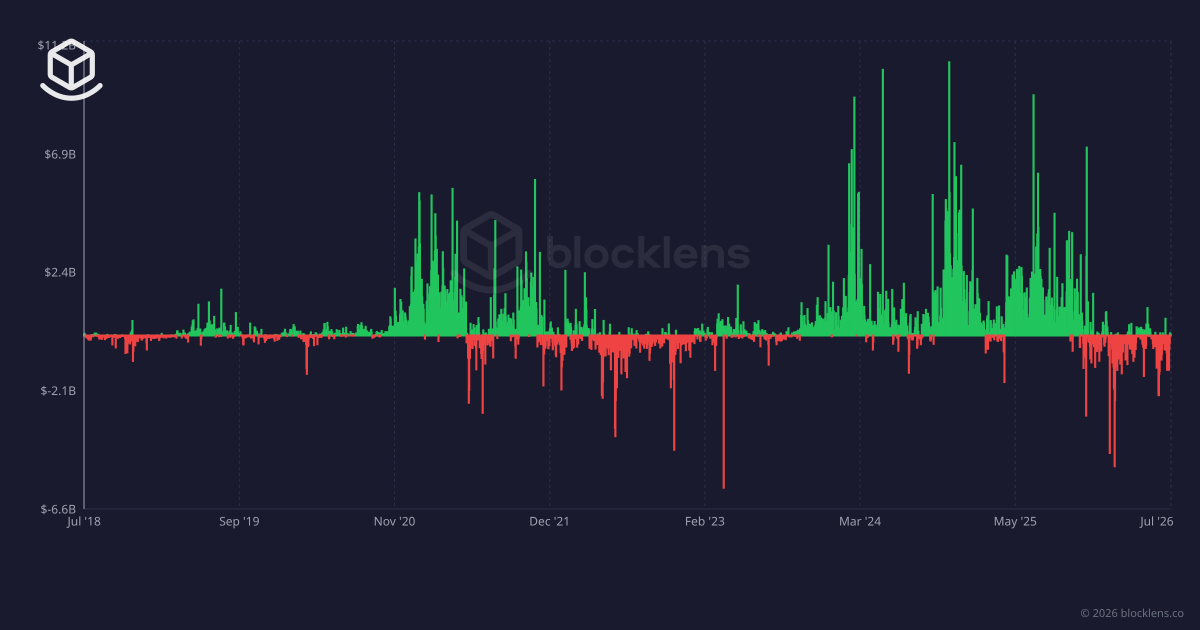
Not paper gains — the actual money locked in or lost each day as coins change hands. How Realized P/L reveals distribution, capitulation, and cycle turns.
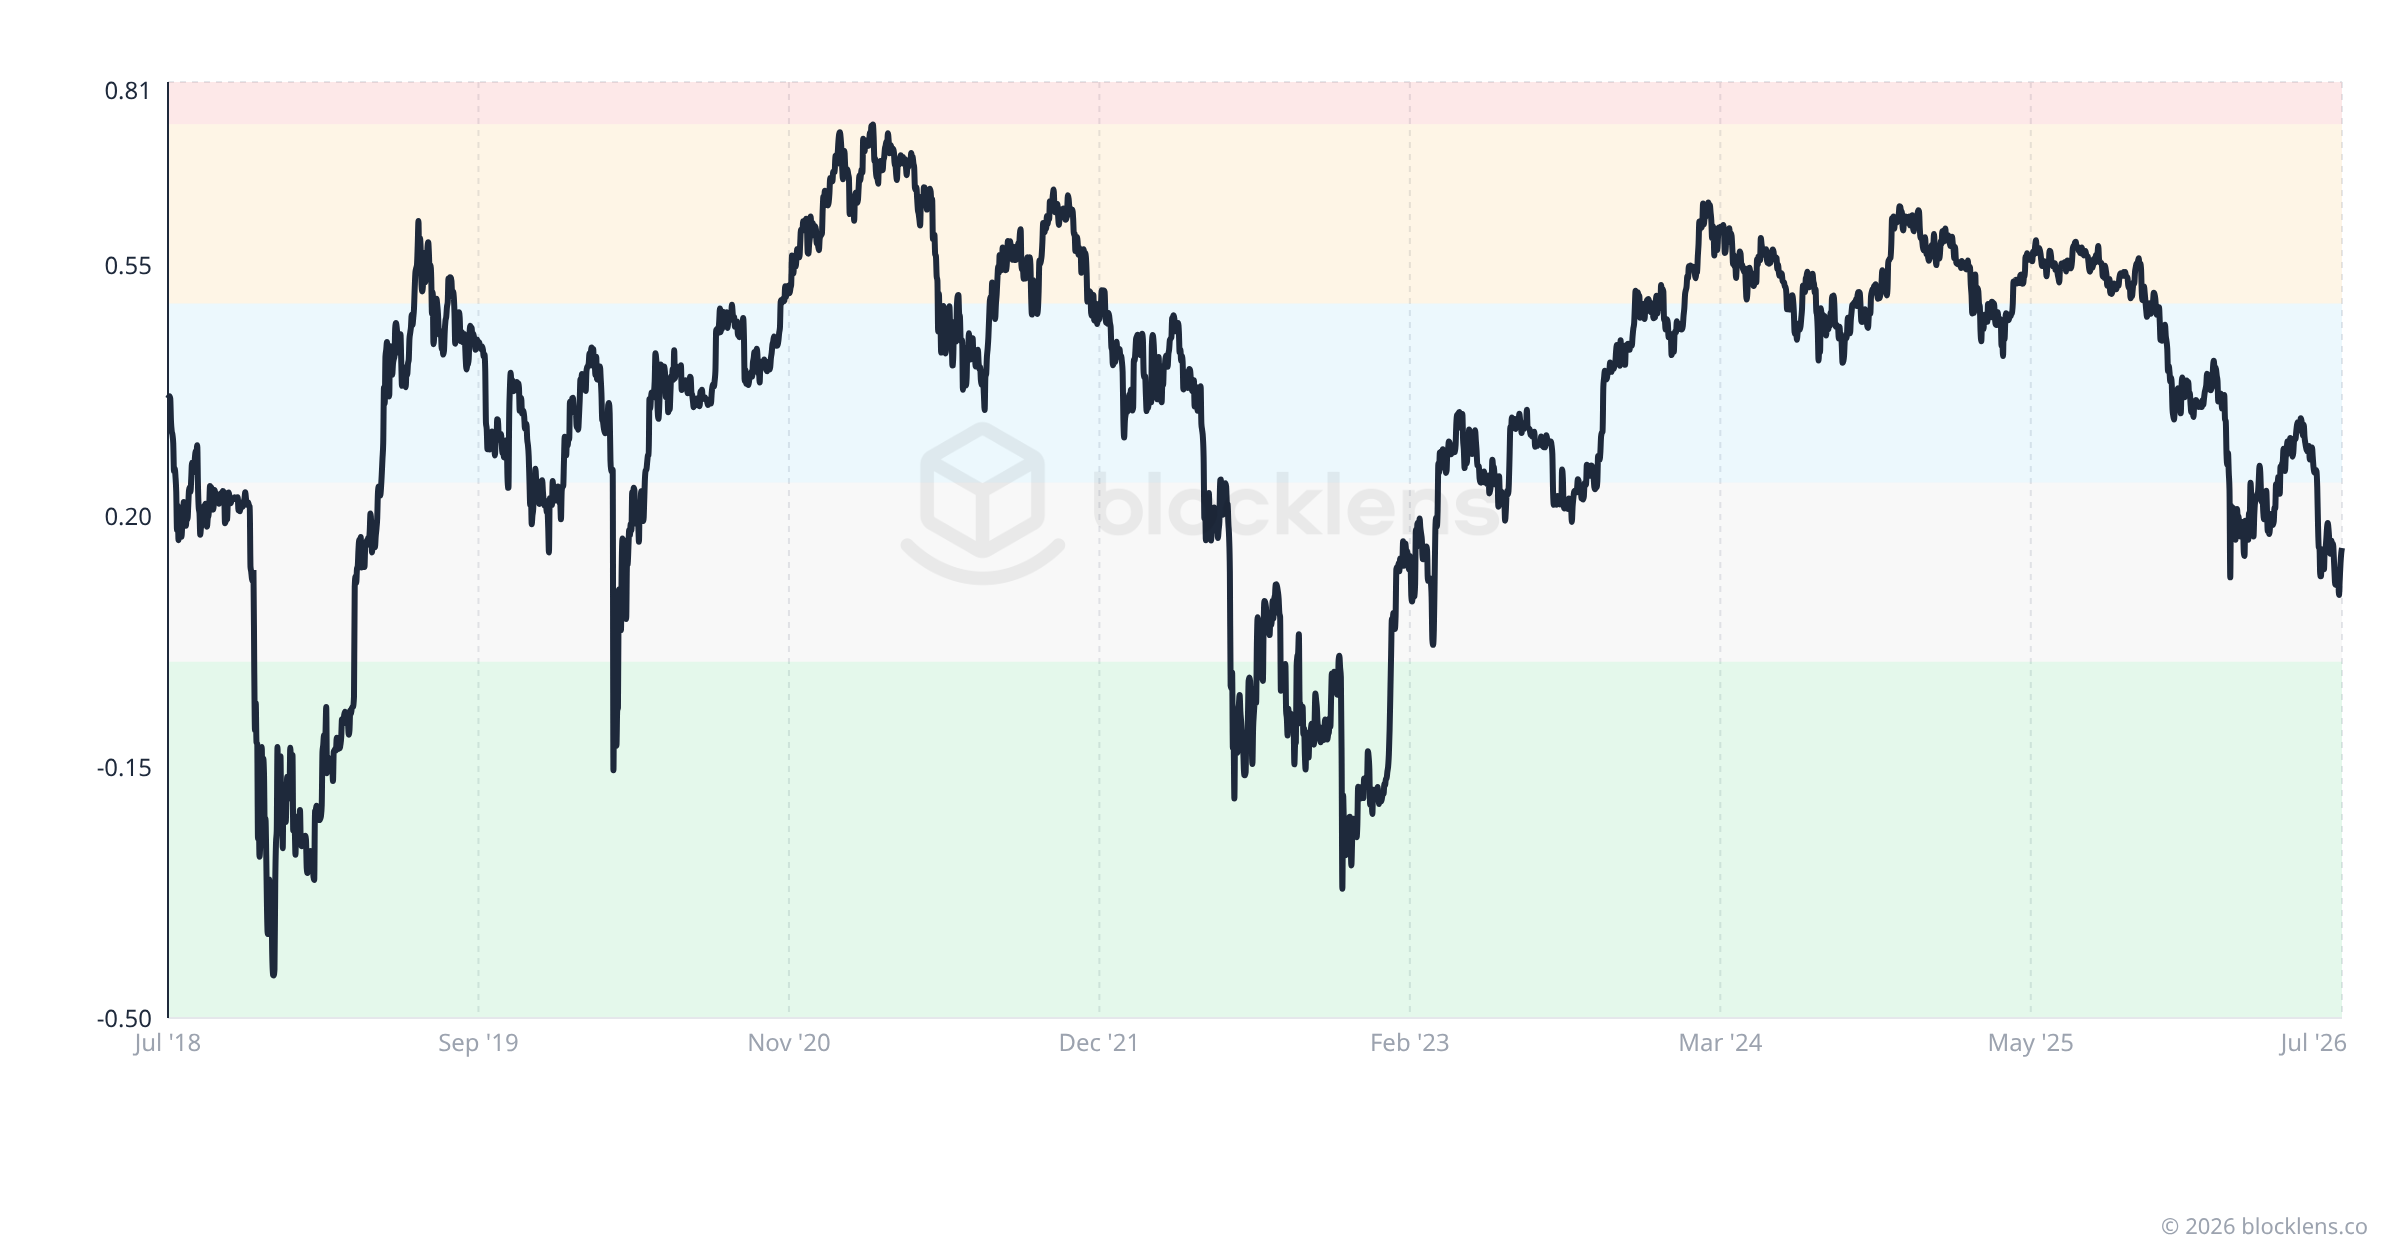
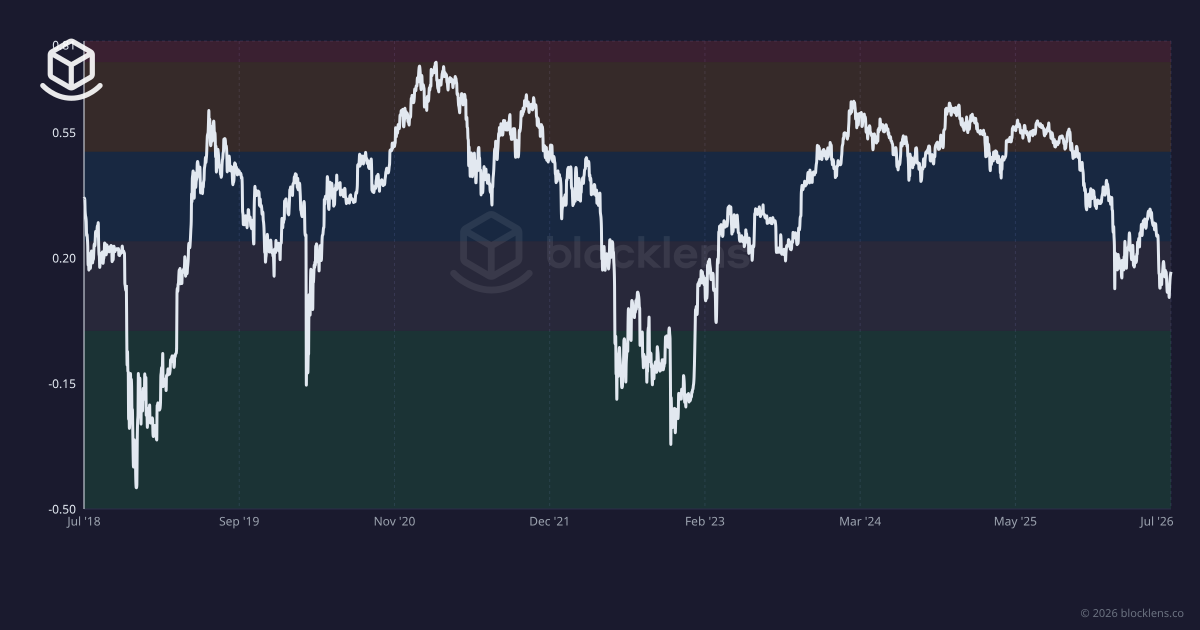
NUPL Explained
NUPL converts the entire network's paper profit into a single mood score — from green Capitulation lows to red Euphoria tops. Learn the emotion bands and where BTC sits today.
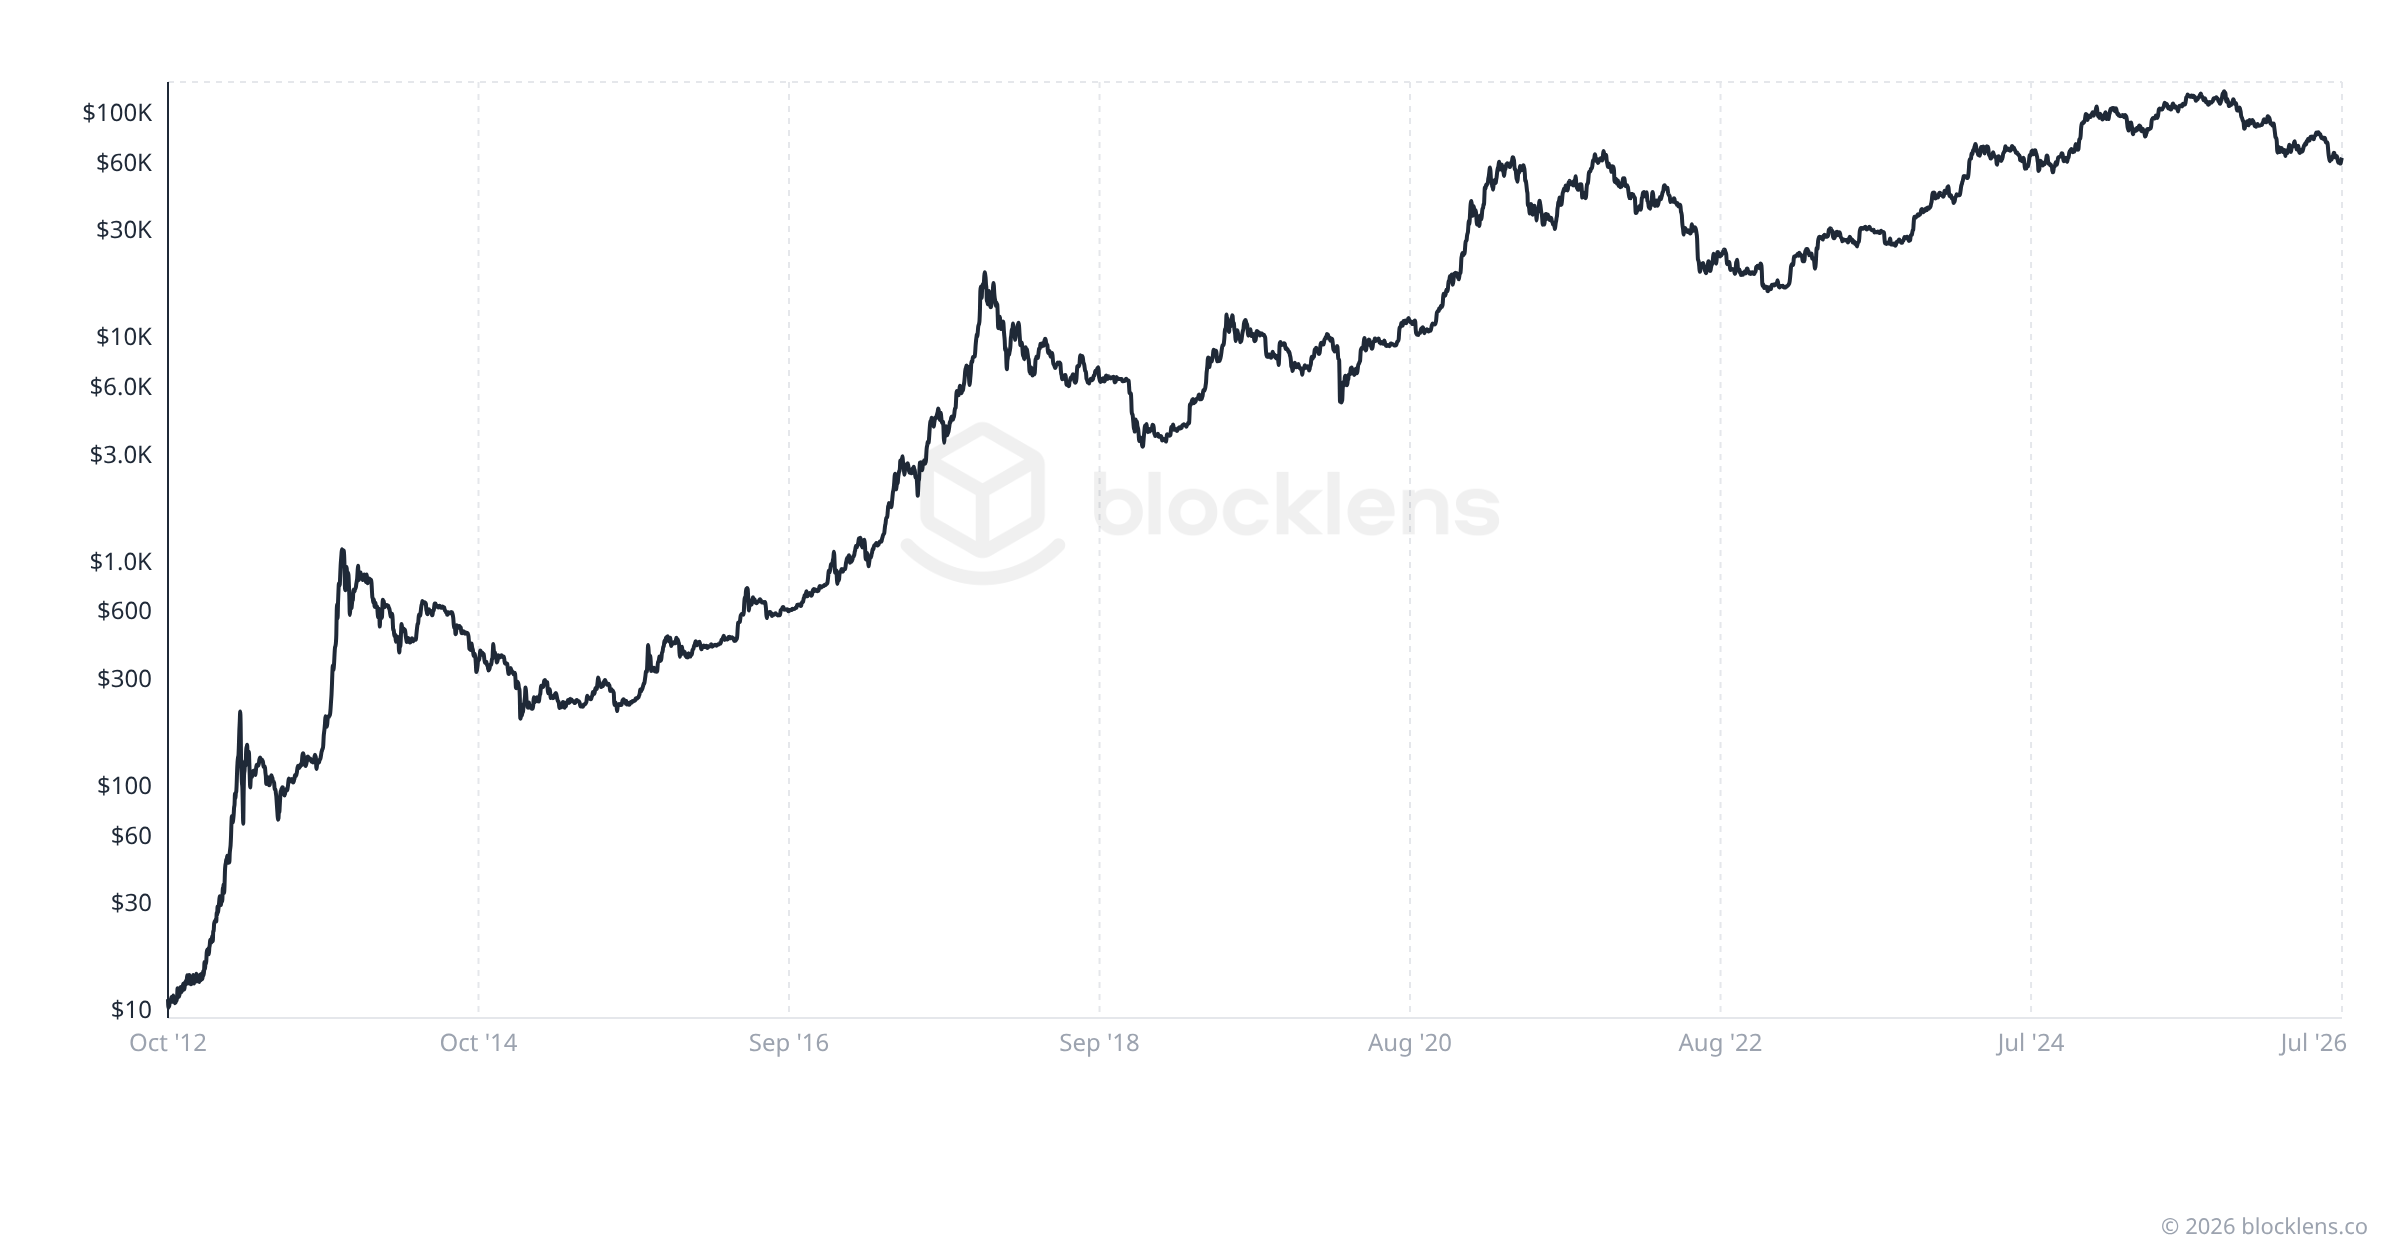
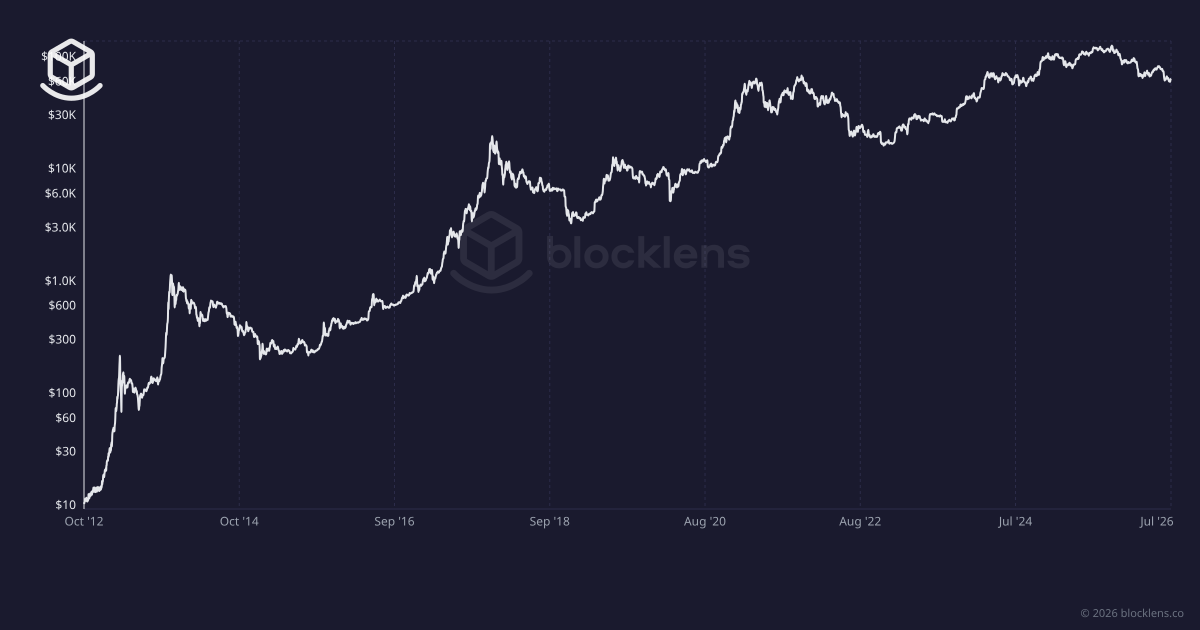
Bitcoin Cycles & Halving
Why Bitcoin moves in multi-year boom-bust waves — and how on-chain metrics like MVRV, NUPL, and SOPR help you locate the wave you're in right now.
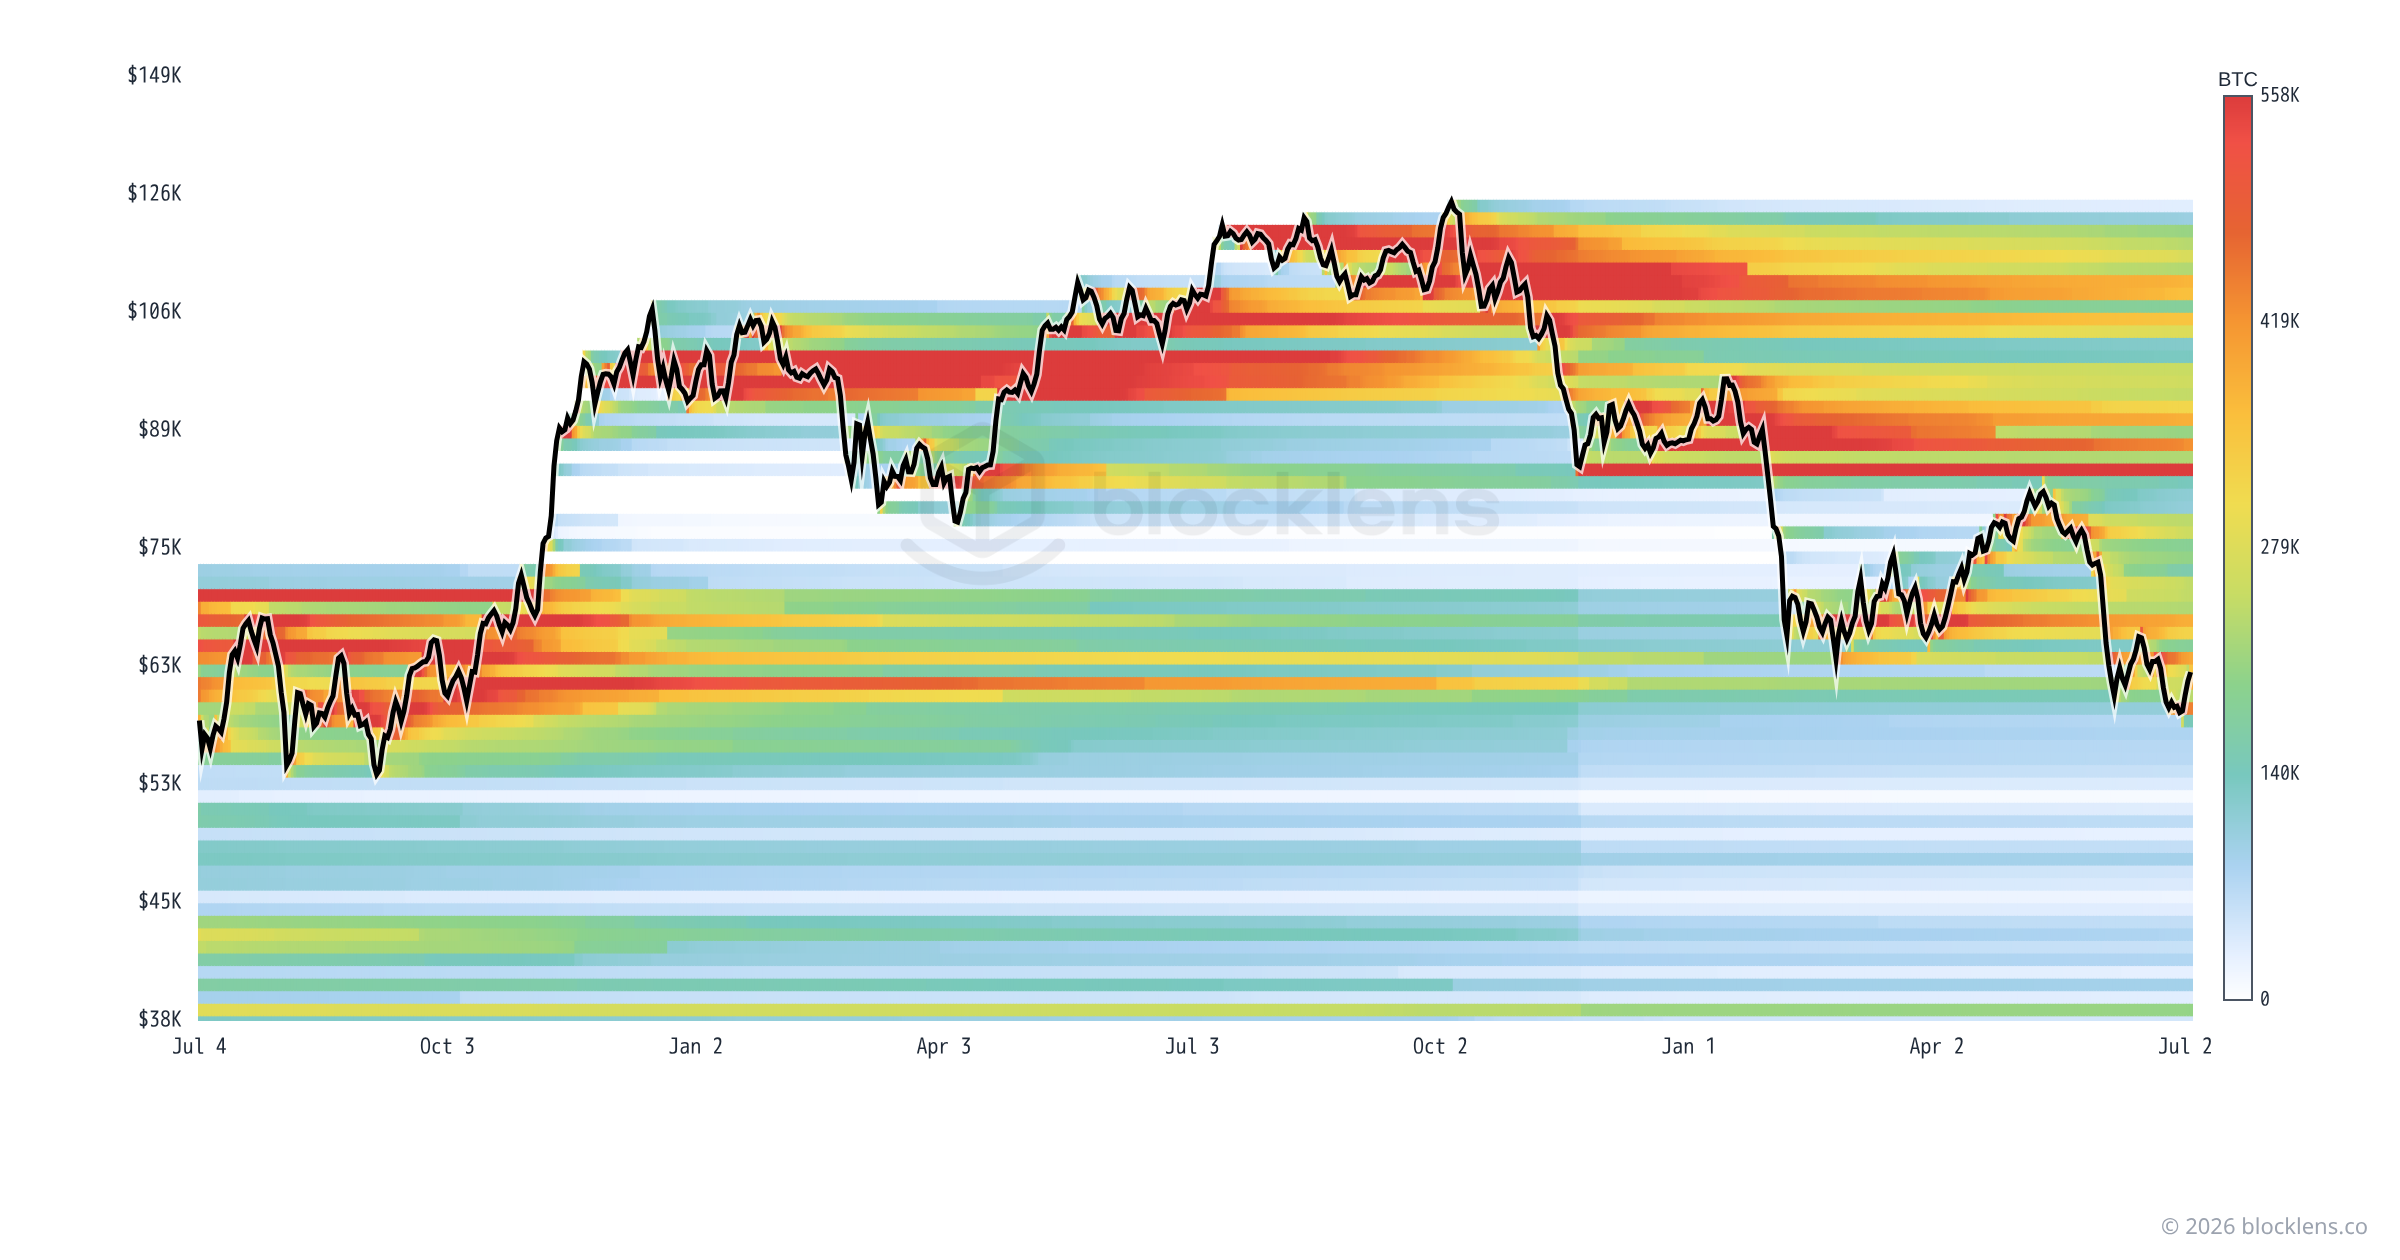
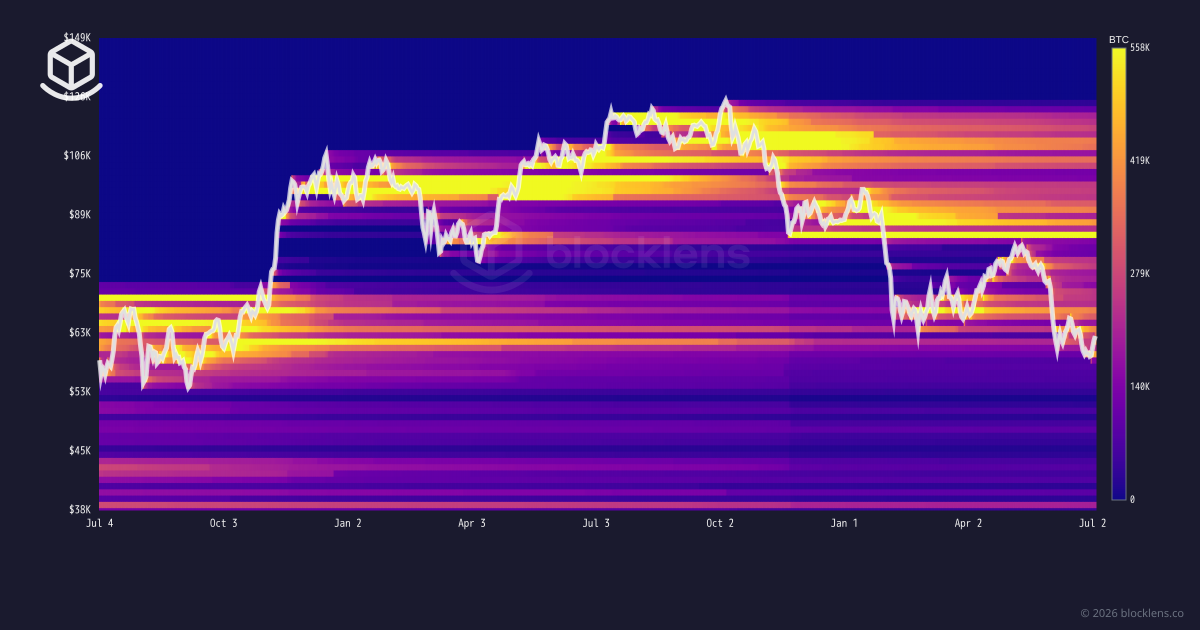
Cost-Basis Distribution
The Cost Basis Distribution maps every coin to the price it was last bought at. Learn to read its support walls, resistance bands, and what today's overhead supply means.