Stop staring at on-chain analytics dashboards. Get the answers.
Ask a question → get custom reports, explainable charts, ETF/DAT intelligence and cohort analysis. Schedule it as a feed → delivered to Telegram, email, web or your agent.
thesis
channel
native
Favourites
My Charts
Blocklens Charts
AI on-chain analyst, on demand
You have data. You don't have answers.
On-chain tools give you charts. But charts don't tell you why things move, what it means for your position, or what to do next. You still have to find the right metric, read the chart, connect it to the news, write it up — and do it all again tomorrow. Blocklens turns that entire loop into a single prompt.
The Manual Loop
Hours spent querying, screenshotting, pasting into docs and notes. Then redoing it all the next day when the data updates.
Paying for Charts, Not Answers
$50–999/mo for tools that show you numbers but can't tell you what they mean. Static dashboards. Generic alerts. No story, no context, no clarity on what to actually do.
Fragile AI Plumbing
Plugging your LLM into random APIs and hoping nothing breaks. Most analytics platforms were built before MCP existed. Blocklens was built for it.
Everything you need to turn data into decisions.
The on-demand on-chain analyst.
No English required. Ask in your native language and Buddy answers in it — a fully-cited report with charts, cohort data, ETF context and a clear bottom line, ready in minutes, not days.
- Reports on any theme, any timeframe, any cohort
- Pulls live data from 200+ on-chain metrics (MVRV, NUPL, SOPR, URPD, LTH/STH, Puell — you name it)
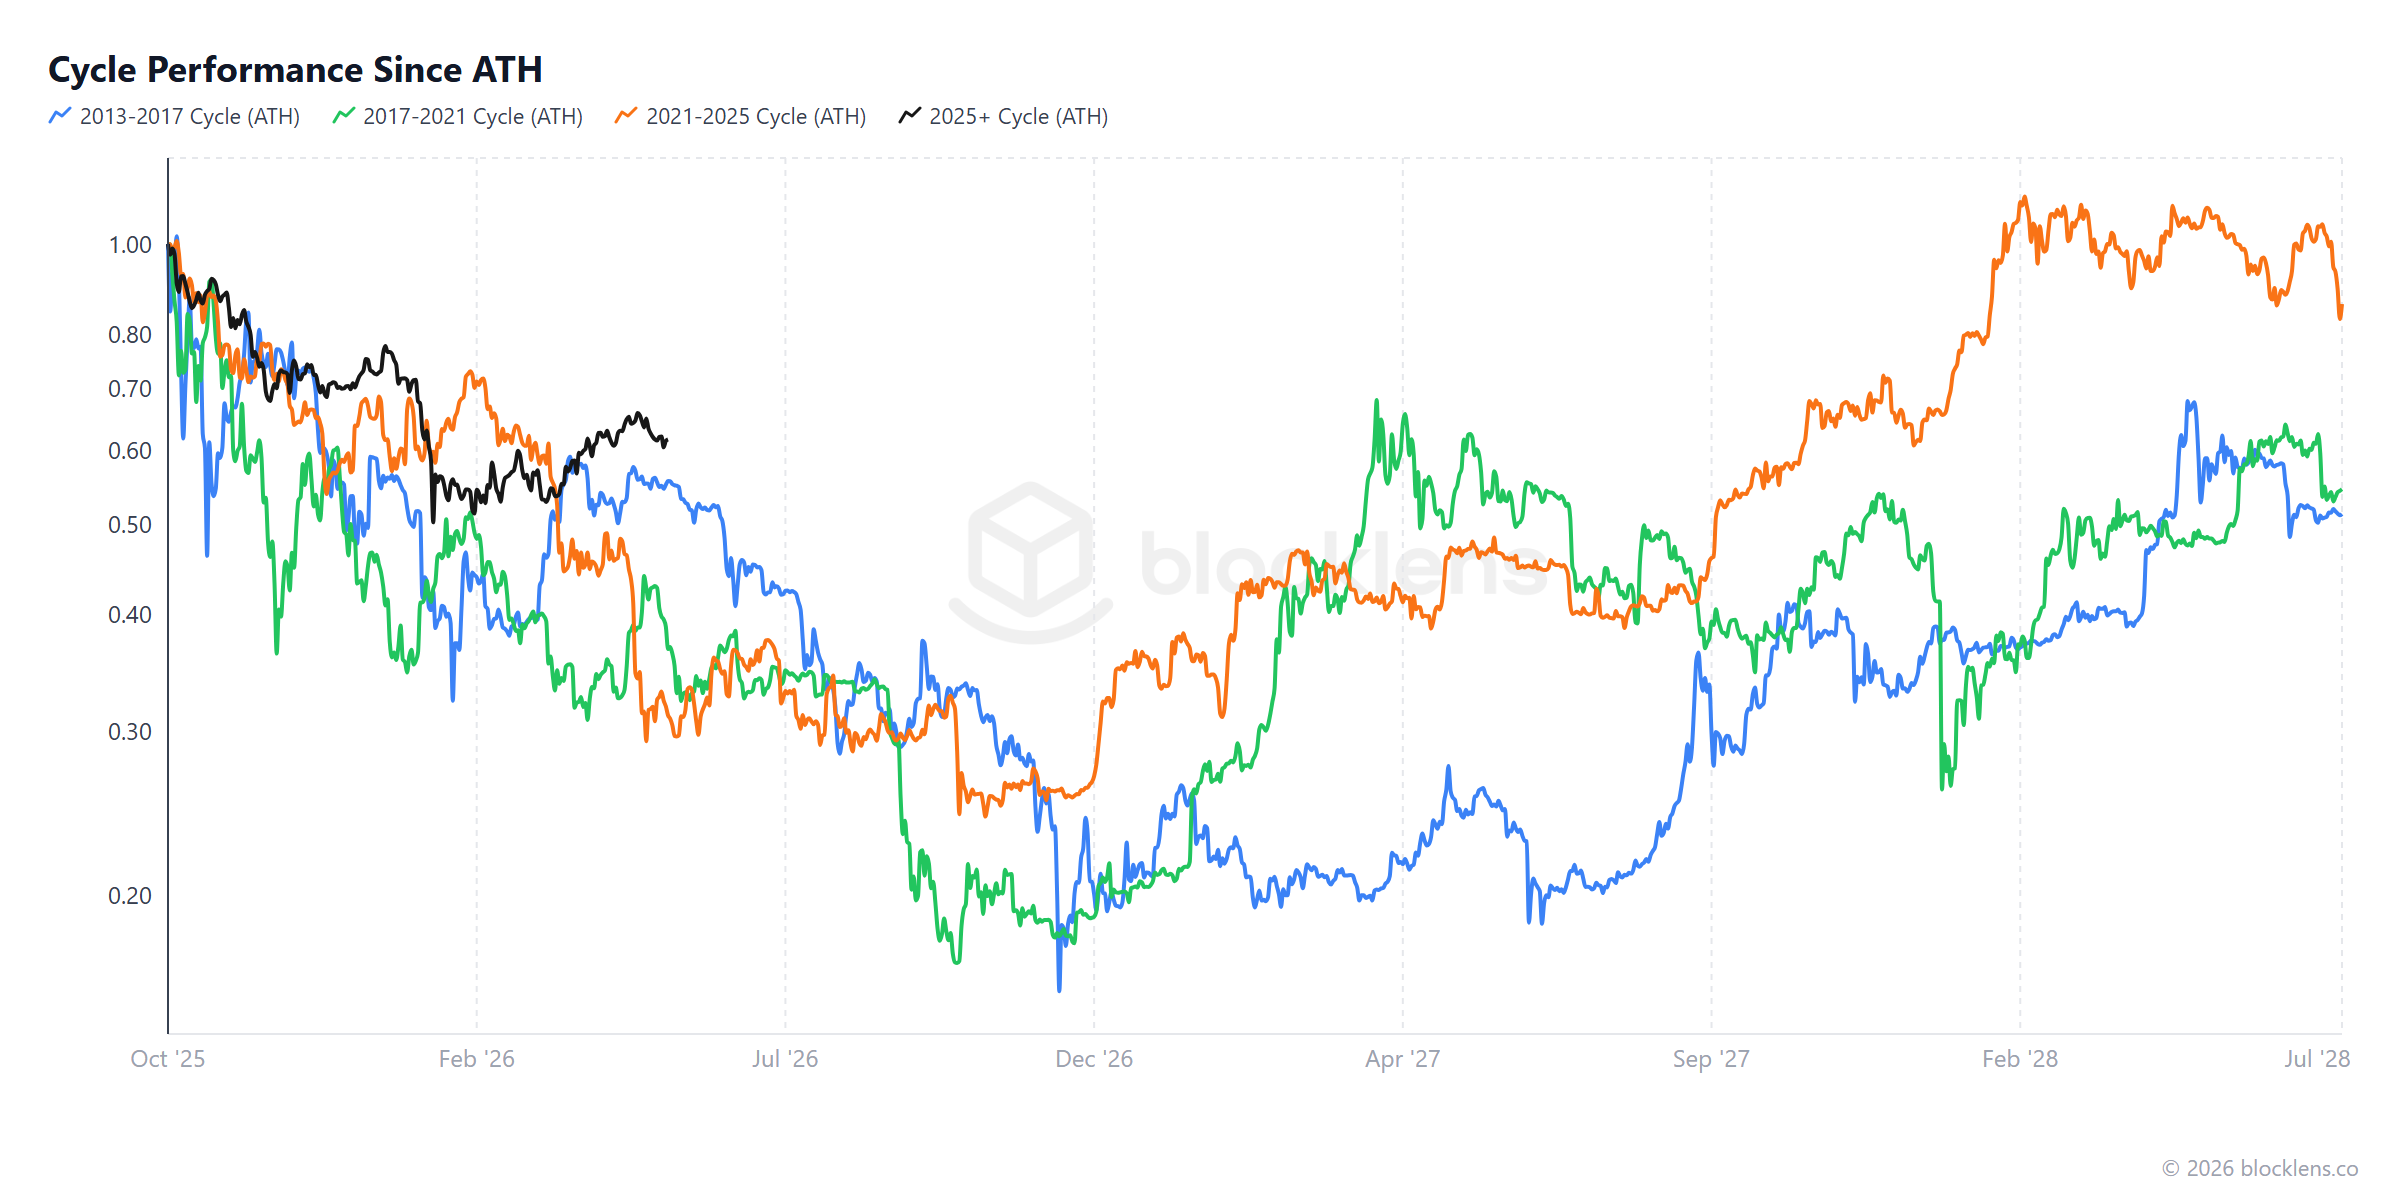
- Cycle phase detection with probabilistic scenario modeling or policy regime change analysis — Buddy handles both equally well
- From short message briefs to full-length PDF research reports
- Export as PDF, markdown, or share-link — citation-ready
AI on-chain analyst, on demand
A news feed that's actually about your thesis.
Define a theme — "MSTR-style DATs," "LTH distribution," "ETF dispersion" — and Blocklens delivers a custom AI-curated brief on your schedule. Email, Telegram, or web panel.
- Any topic, any cron schedule — daily 7AM brief, weekly cohort recap, intraday alerts
- Cross-references news with live on-chain signals — not just headlines
- Multi-channel, multi-format delivery: email, Telegram, in-app, webhook — as message, PDF, PNG or SVG
- Each item linked to the chart and metric that triggered it
AI on-chain analyst, on demand
No more guessing what on-chain metrics mean.
Buddy explains how every metric is built, what it's saying right now, and how it compares to past cycles — all in plain language, one prompt away. Need a custom chart or dashboard? Just describe it, Buddy will build it. Want manual control? A best-in-class chart editor is right there at your fingertips.
- Custom holder-cohort analysis you won't find elsewhere
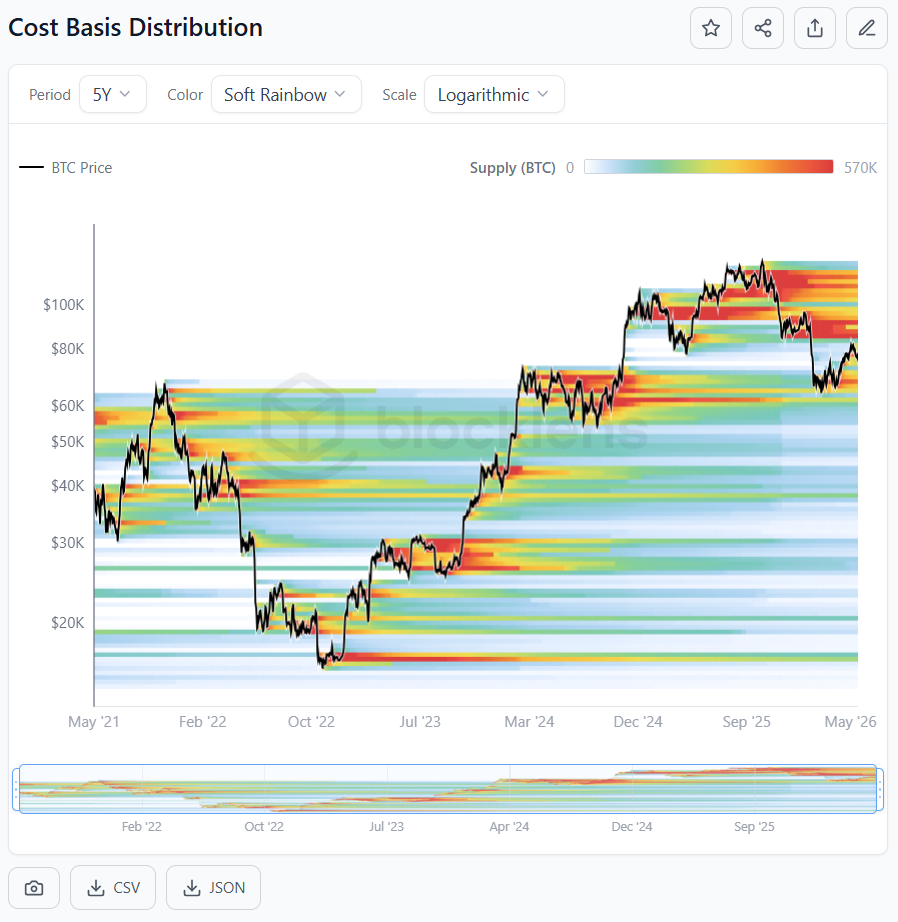
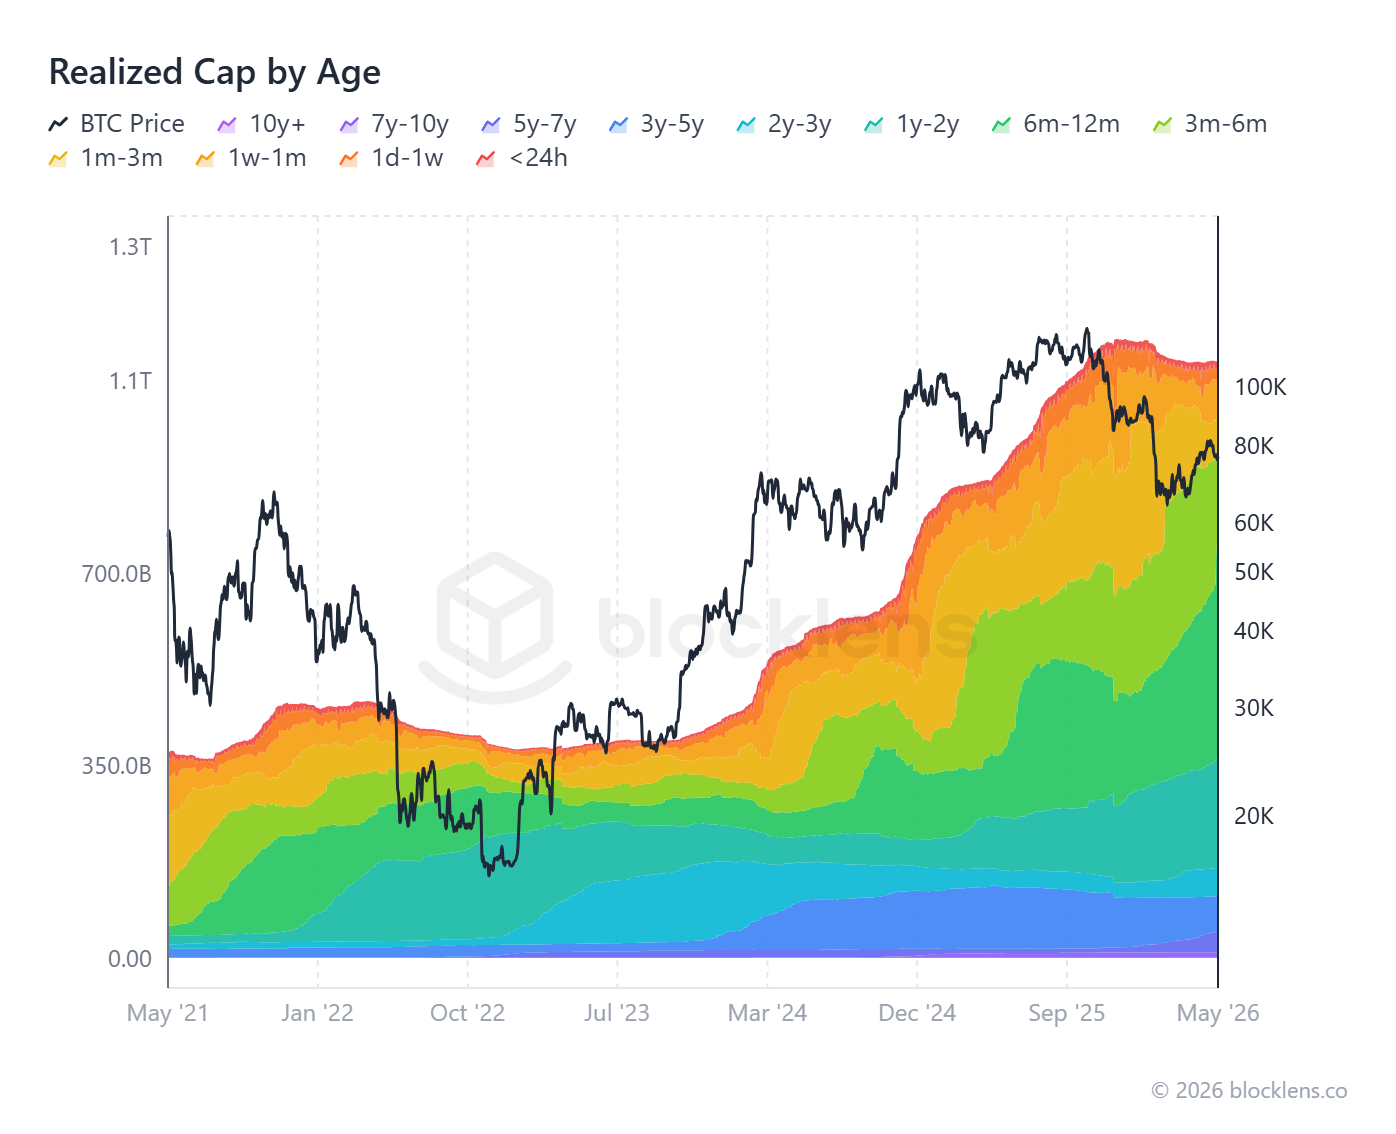
- HODL waves, URPD, SOPR pulse, cycle overlays — all editable, all exportable
- Smart, detailed explanation of every metric on any chart or dashboard
- Tailor chart layouts to your style and publishing format
Your favorite LLM gets a real crypto data layer.
Connect Blocklens to Claude, ChatGPT, Cursor or your internal agent. Query metrics, render charts, explain dashboards, create reports and schedule feeds — without scraping the web or hallucinating data.
Claude / ChatGPT / Cursor
User asks: "Build a BTC flow brief and chart the risk levels."
Live tools, real data
Tools query live metrics, render visuals and return structured intelligence.
Query metrics
19 typed tools covering price, supply, valuation, profitability, coin days, blockchain stats and cycle boundaries.
Render charts
render_chart returns PNG/SVG images directly in the conversation — no browser needed.
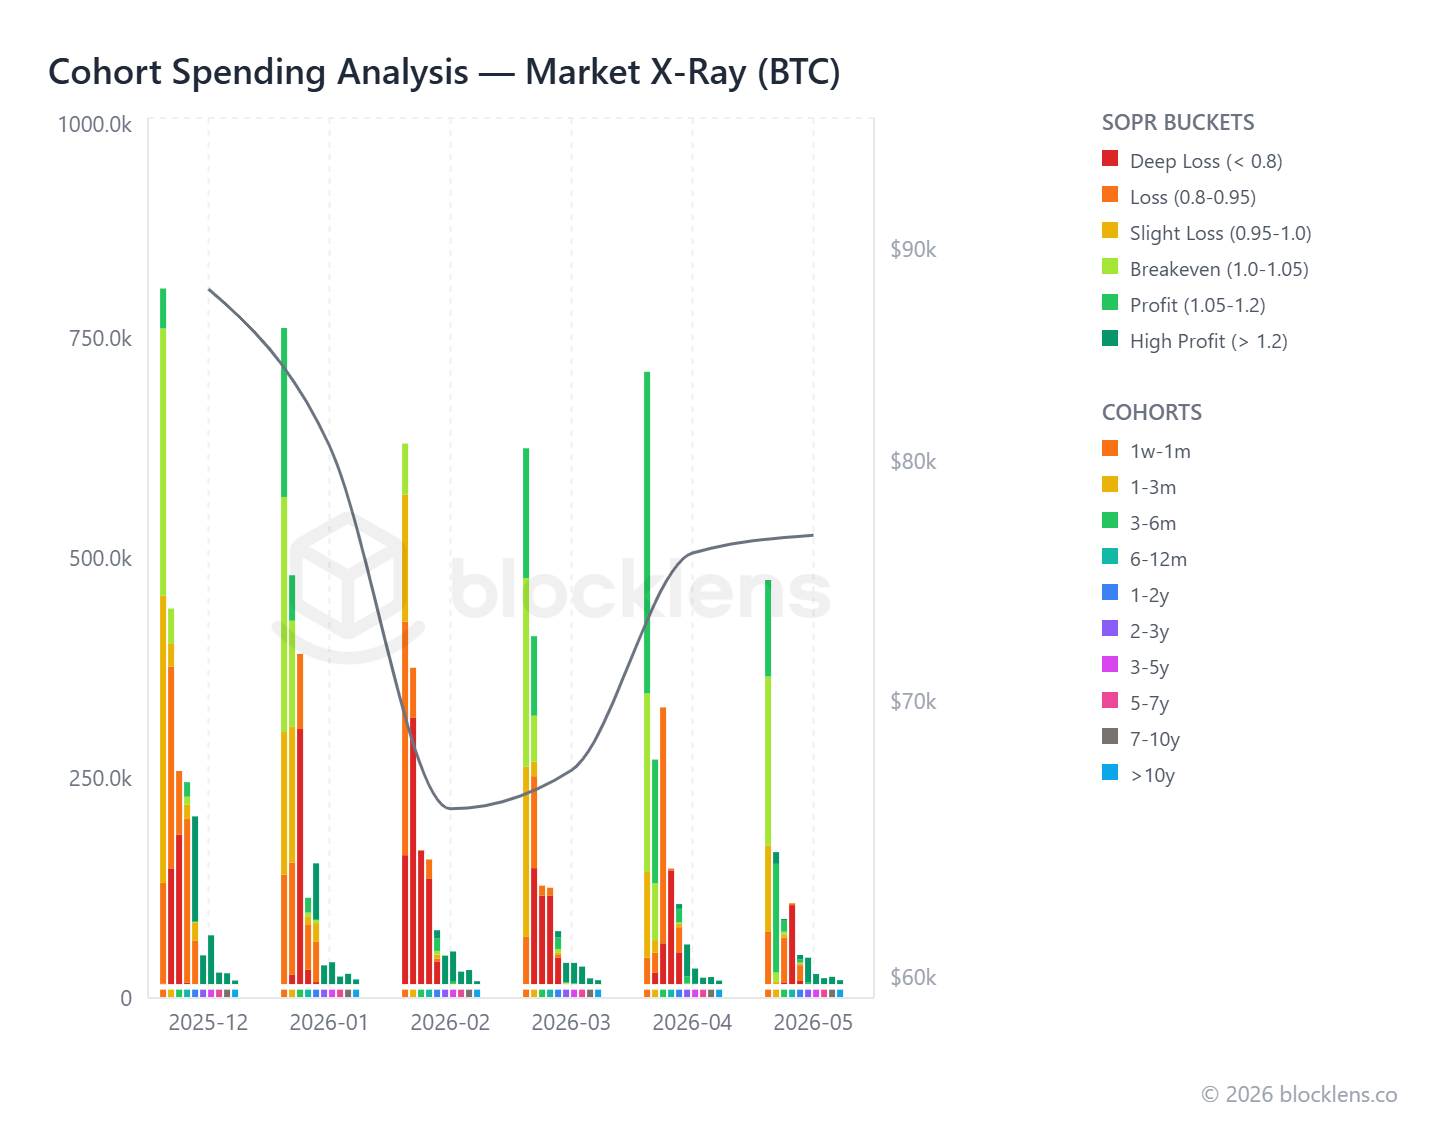
Analyze cohorts
Custom age-bracket cohort analysis: supply, realized price, realized P/L per cohort.
Track ETF & DAT
ETF aggregate flows, DAT entity-level data, per-company holdings and cost basis.
Dashboards show data. Blocklens does the work.
Dashboard tools are chart libraries. Generic AI tools are language interfaces without proprietary market data. Blocklens is the data layer, chart engine and analyst workflow — together.
One platform. Four different jobs to be done.
Daily desk briefings, on autopilot.
Wake up to a custom on-chain memo every morning. Cycle phase, ETF flows, DAT positioning, LTH behavior — synthesized, cited, decision-ready. Plug into your IC deck or LP letter.
"We run Buddy's daily brief alongside our internal research. It catches things our team would've missed."
— Crypto Fund Portfolio Manager
Skip the data engineering. Ship the strategy.
Pipe 200+ metrics into your agent via MCP. Backtest with structured, point-in-time data. Get inline chart rendering, live ETF flows, and DAT-entity granularity through one typed API.
"Replaced 600 lines of scraping code with one MCP config. My agent ships analysis now."
— Solo quant, ex-Jane Street
From data to publishable thesis in one afternoon.
Build a chart from a sentence. Get a regime-change annotation auto-written. Export citation-ready figures. Publish to Substack, Twitter, or a fund memo without leaving the tab.
"I shipped a 2,000-word cycle piece in 90 minutes — every chart Blocklens, every claim cited."
— Independent on-chain researcher
Break stories faster with live on-chain data.
Generate publication-ready charts in seconds. Pull real metrics for articles, Twitter threads, and newsletters. Every number backed by a source, every chart exportable as PNG or SVG.
"Blocklens cut my research time in half. I tweet charts that used to take me 40 minutes to build."
— Crypto media editor
Research that leads to action.
Deep-dive analysis paired with working tools — so your next move is backed by data, not guesswork.


The Blocklens-TOP Model
Defining the Bitcoin Cycle Top through capital flow and long-term holder behavior

On-Chain Basics
An 8-part guide to on-chain Bitcoin analysis — from first principles to cycle modeling
Stop reading charts. Start a conversation with your data.
Get Enterprise access free for two months. Help shape the future of on-chain analytics.
Join Soft Launch