In Part 1 we established the foundation: every bitcoin carries the price it last moved at, and when you average those prices across all 20 million coins you get the Realized Price — the network's aggregate cost basis. Now we take that number and do one simple thing with it: divide it into today's price. That ratio is MVRV, and it is arguably the single most useful on-chain metric a beginner can learn.
MVRV stands for Market Value to Realized Value. The name sounds technical, but the idea is almost childishly simple once you have the Realized Price concept from Part 1. This article will show you what the ratio means, where its historically significant thresholds are, why those thresholds shift over time, and how to read the version that breaks the market into long-term and short-term holders — which is where the real insight lives.
The formulaOne division, one powerful signal
Here is the formula, exactly as it appears in every serious on-chain analysis paper:
$$\text{MVRV} = \frac{\text{Market Cap}}{\text{Realized Cap}} = \frac{P_t}{\text{Realized Price}}$$You can read it either way — the ratio of the two big caps, or equivalently, today's price divided by the Realized Price. Both give you the same number. What does that number mean?
- MVRV = 1 — price sits exactly on the network's average cost basis. The average holder is breaking even. Historically this level has acted as pivotal support in bull markets and fierce resistance in recovery rallies after a bear.
- MVRV > 1 — the market is in aggregate profit. The further above 1, the more profit has accumulated — and the more "fuel" exists for holders to sell.
- MVRV < 1 — the market is in aggregate loss. The average holder is underwater. This is rare, and when it has happened it has coincided with some of the best buying opportunities in Bitcoin's history.
Key idea
MVRV is not a price prediction tool. It is a valuation thermometer — it tells you whether Bitcoin is currently trading above or below what the entire network collectively paid for it, and by how much. When the temperature gets very high, history says be careful. When it drops below zero (MVRV < 1), history says generational opportunity — but there are no guarantees.
Reading the mapWhere the extremes have lived historically
The power of MVRV comes from the fact that its extremes have been remarkably consistent across multiple market cycles. Let's walk through what each zone has looked like.
Below 1 — the capitulation zone
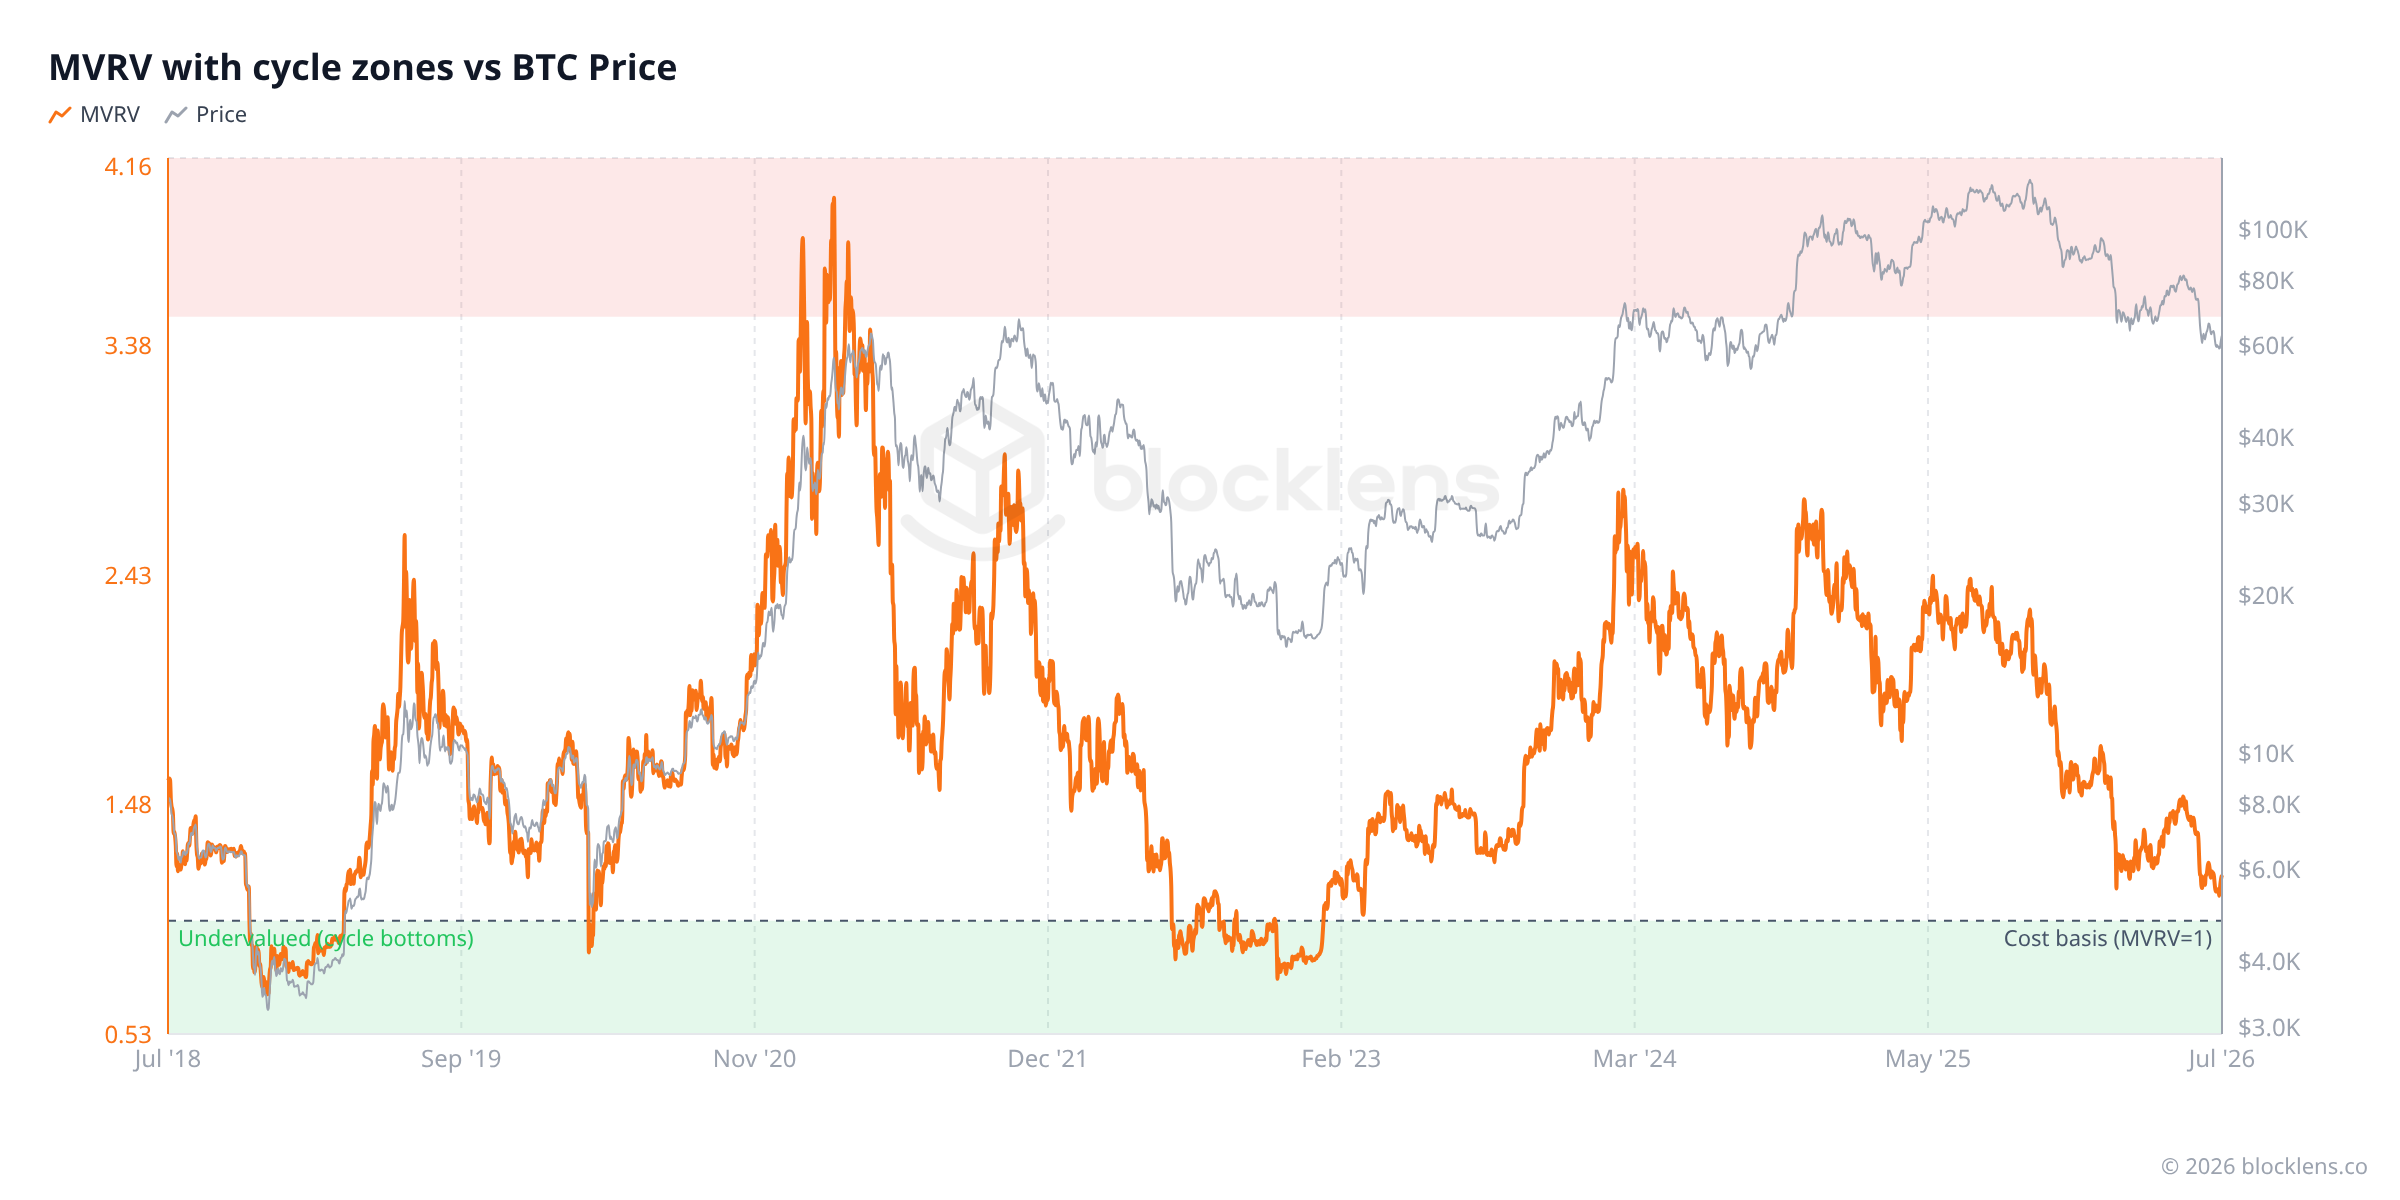
When MVRV drops under 1, the average holder is losing money. To reach this level, price must fall below the weighted average of what everyone paid — including long-term holders who bought years ago at much lower prices. That takes an extraordinary sell-off. It has happened only a handful of times: during the brutal bear market of late 2018, in the March 2020 COVID crash, and again in late 2022 after the FTX collapse. Each instance proved to be a multi-year cycle bottom — the kind of moment that looks obvious in hindsight and agonizing in real time.
At 1 — the cost-basis pivot
The MVRV = 1 level is where aggregate profit and loss flip. In a recovering market, reclaiming this line from below has often been the signal that a new bull cycle has traction. Losing it in a declining market has often marked the transition from bull to bear. It is worth watching every time price approaches the Realized Price.
Above 3.5 — the overheated zone
When MVRV climbs above roughly 3.5, the network is sitting on 2.5x its cost basis in aggregate unrealized gains. Historically this level has appeared near cycle tops — the late 2017 peak, the early 2021 surge, and the April 2021 top all saw MVRV breach this band. The logic is intuitive: the higher the collective paper profit, the greater the pressure to sell, and the harder it becomes to find new buyers willing to pay a price that already discounts all that optimism.
Worth knowing
If you look carefully at Figure 1, you will notice something that seasoned analysts watch closely: each cycle's MVRV peak has come in lower than the previous one. The 2013 peak was astronomical, the 2017 peak was high, the 2021 peaks were lower still, and the 2025 cycle top came in at a fraction of historical extremes. This is not a coincidence — it is the natural result of a maturing, larger-cap market. As Bitcoin's market cap grows into the trillions, it takes proportionally more capital to push MVRV to extreme levels. So treat 3.5 as a useful signpost, not an iron rule. A bull market can turn before MVRV reaches 3.5, and no threshold works every cycle. Use MVRV as one lens among several, not as a standalone timer.
Going deeperThe split that aggregate MVRV hides
Here is where MVRV gets genuinely interesting — and where most beginner explanations stop short. The single MVRV number you see on most charts is an average across the entire market. But the Bitcoin market is not a homogeneous group of people who all bought at the same time. It is a stack of cohorts, some of whom have held for years and others who bought last month.
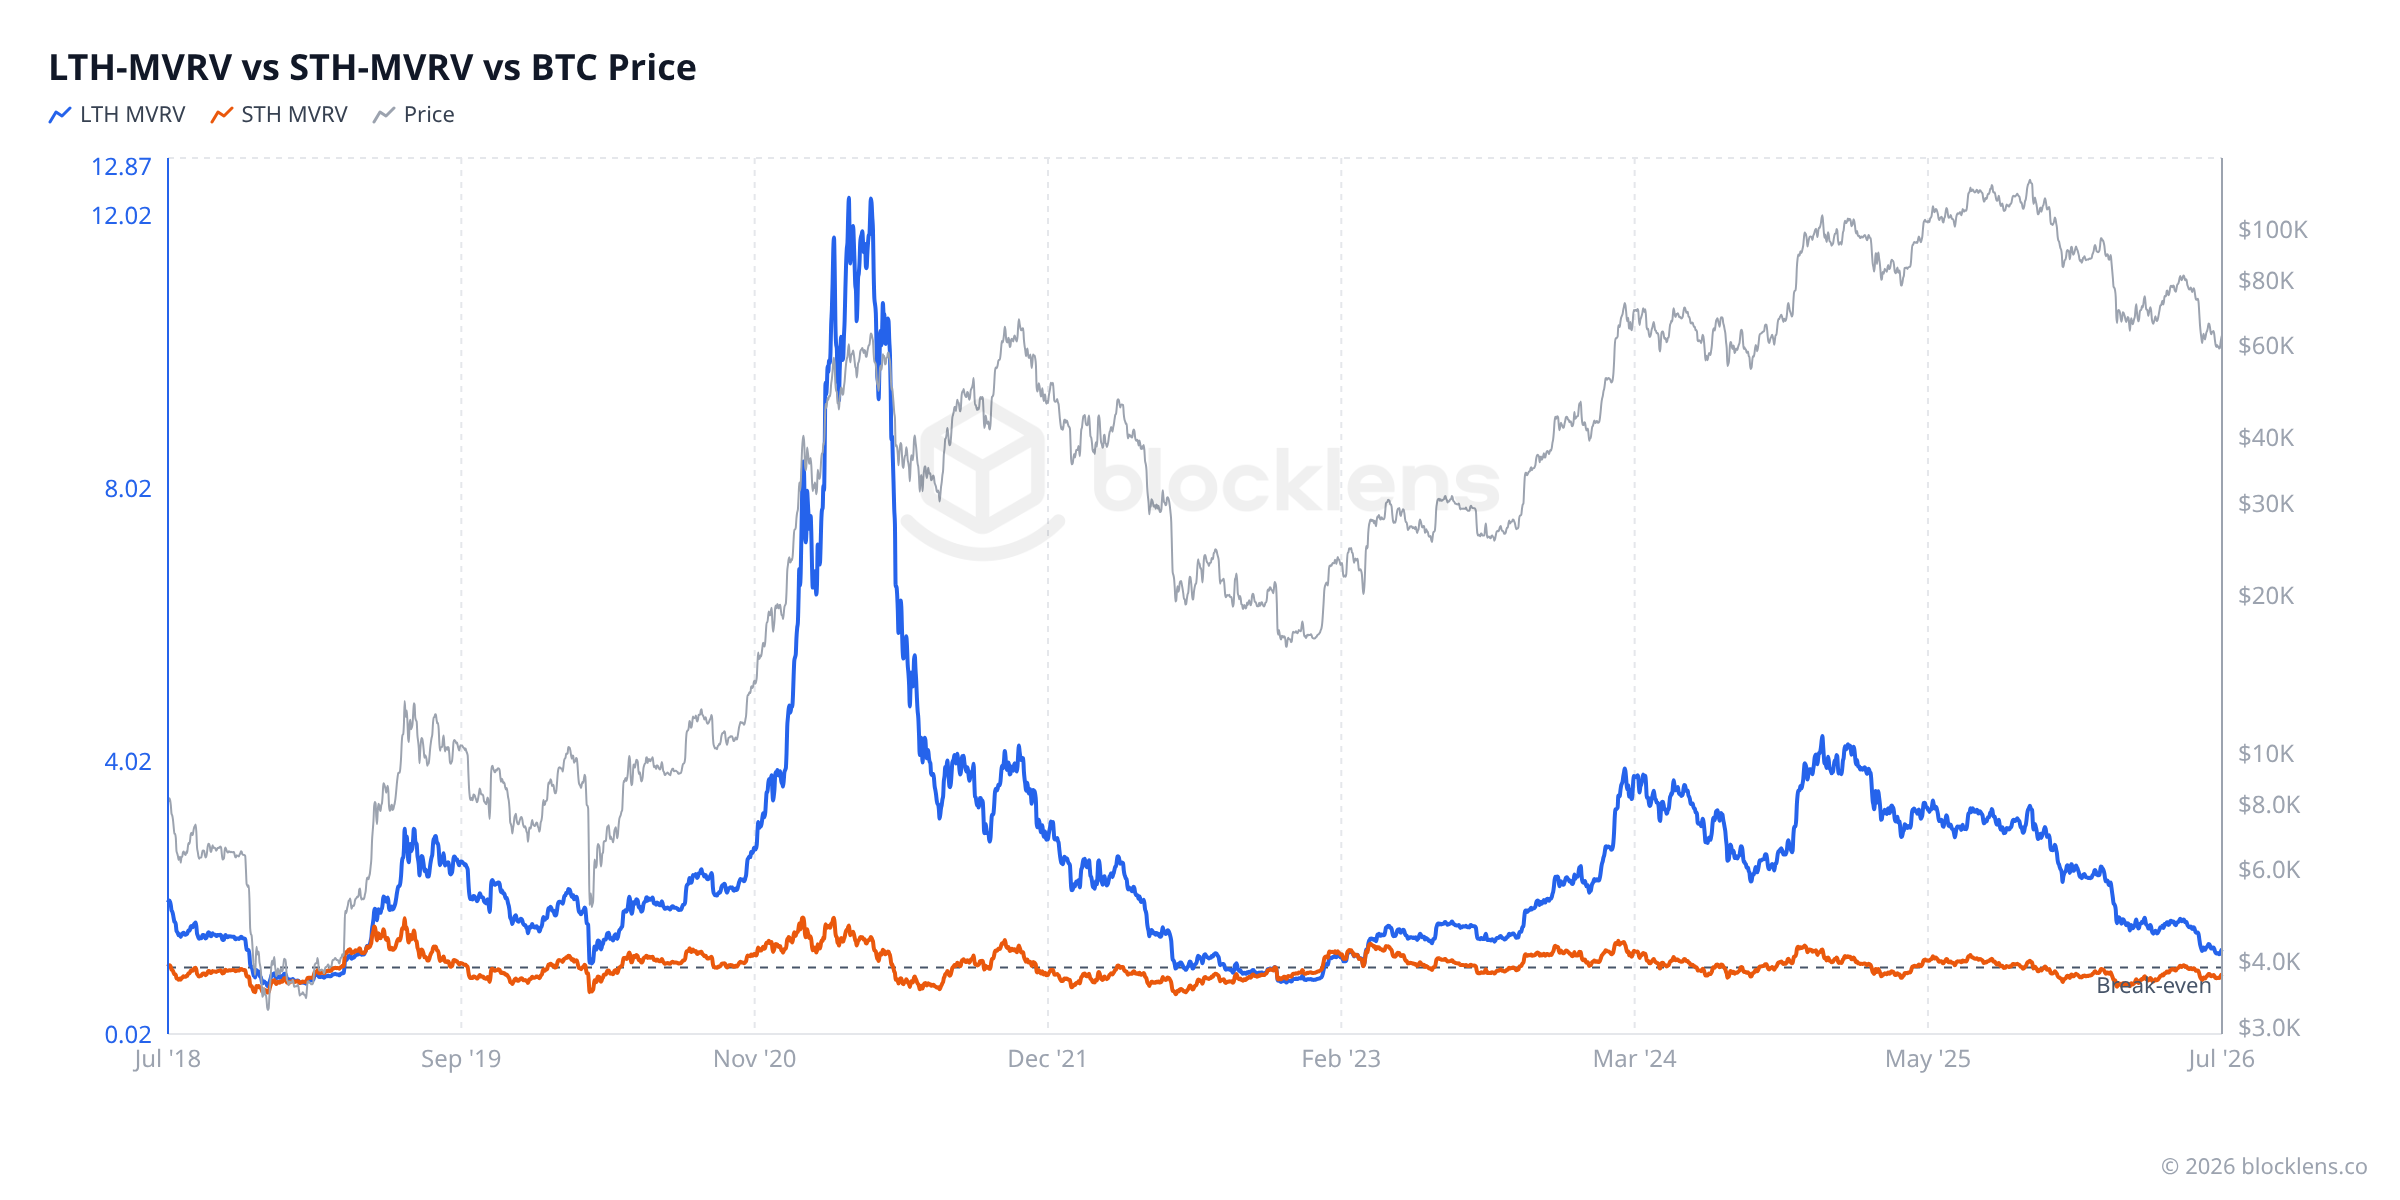
As we saw in Part 2, on-chain analysis splits the market into two cohorts by how long their coins have sat still: long-term holders (LTH) — patient hands whose coins have been dormant for 155 days or more, with a cost basis well below today's price — and short-term holders (STH), recent buyers whose coins moved within the last 155 days. Each cohort has its own Realized Price (calculated the same way, but counting only that cohort's coins), and therefore its own MVRV. And right now, those two numbers tell completely different stories.
As of 4 July 2026:
- LTH-MVRV ≈ 1.27 — long-term holders are comfortably in profit. Their average cost basis (≈ $49,700) sits well below the current price of ≈ $62,830. They have no urgent pressure to sell and can ride out volatility with ease.
- STH-MVRV ≈ 0.90 — short-term holders are underwater. Their average cost basis (≈ $69,700) is significantly above the current price. They are sitting on aggregate losses of roughly 10%, which creates psychological pressure: will they hold, or capitulate and sell into weakness?
That divergence — patient money in profit, recent money in pain — is one of the most telling patterns in a mid-cycle consolidation. It tells you exactly who is feeling the market's weight.
A smarter thresholdAdaptive rails: the geometric σ bands
Remember the catch with the 3.5 threshold — it decays. It flagged the 2017 top, but the 2021 and 2025 tops never came close; a fixed line drawn in the sand keeps drifting out to sea. There is a cleaner fix, and it is the single most valuable upgrade you can make to MVRV: stop using a fixed number, and instead measure how far MVRV sits from its own recent normal.
The fix is to draw rails around MVRV itself. Take MVRV's average over the last four years — roughly one full cycle — and its typical spread around that average (one standard deviation, σ). Then draw bands one and two σ above and below that average, right on the MVRV chart:
- MVRV pushing through the +2σ rail — unusually stretched relative to its own recent history; historically the zone of cycle tops.
- MVRV near the center line — sitting right on its four-year normal.
- MVRV on the −1σ…−2σ rails — unusually cheap; historically the zone of major bottoms.
The magic is that the rails are recomputed every day. As the market matures and MVRV's swings shrink, the rails narrow and drift down with it — look at how the red +2σ ceiling itself declines across the chart below. There is no fixed number left to go stale: the threshold adjusts itself.
One detail that makes it honest
MVRV is a ratio — it multiplies rather than adds (a move from 1 to 2 is the same "size" as 2 to 4). So the average and spread are measured on its logarithm, the statistically correct way to handle a skewed, always-positive quantity. Done on the raw number, the bands would be lop-sided and could even dip below zero — impossible for MVRV. The log version is symmetric and well-behaved. (Analysts call this a log-normal, or geometric-σ, band.)
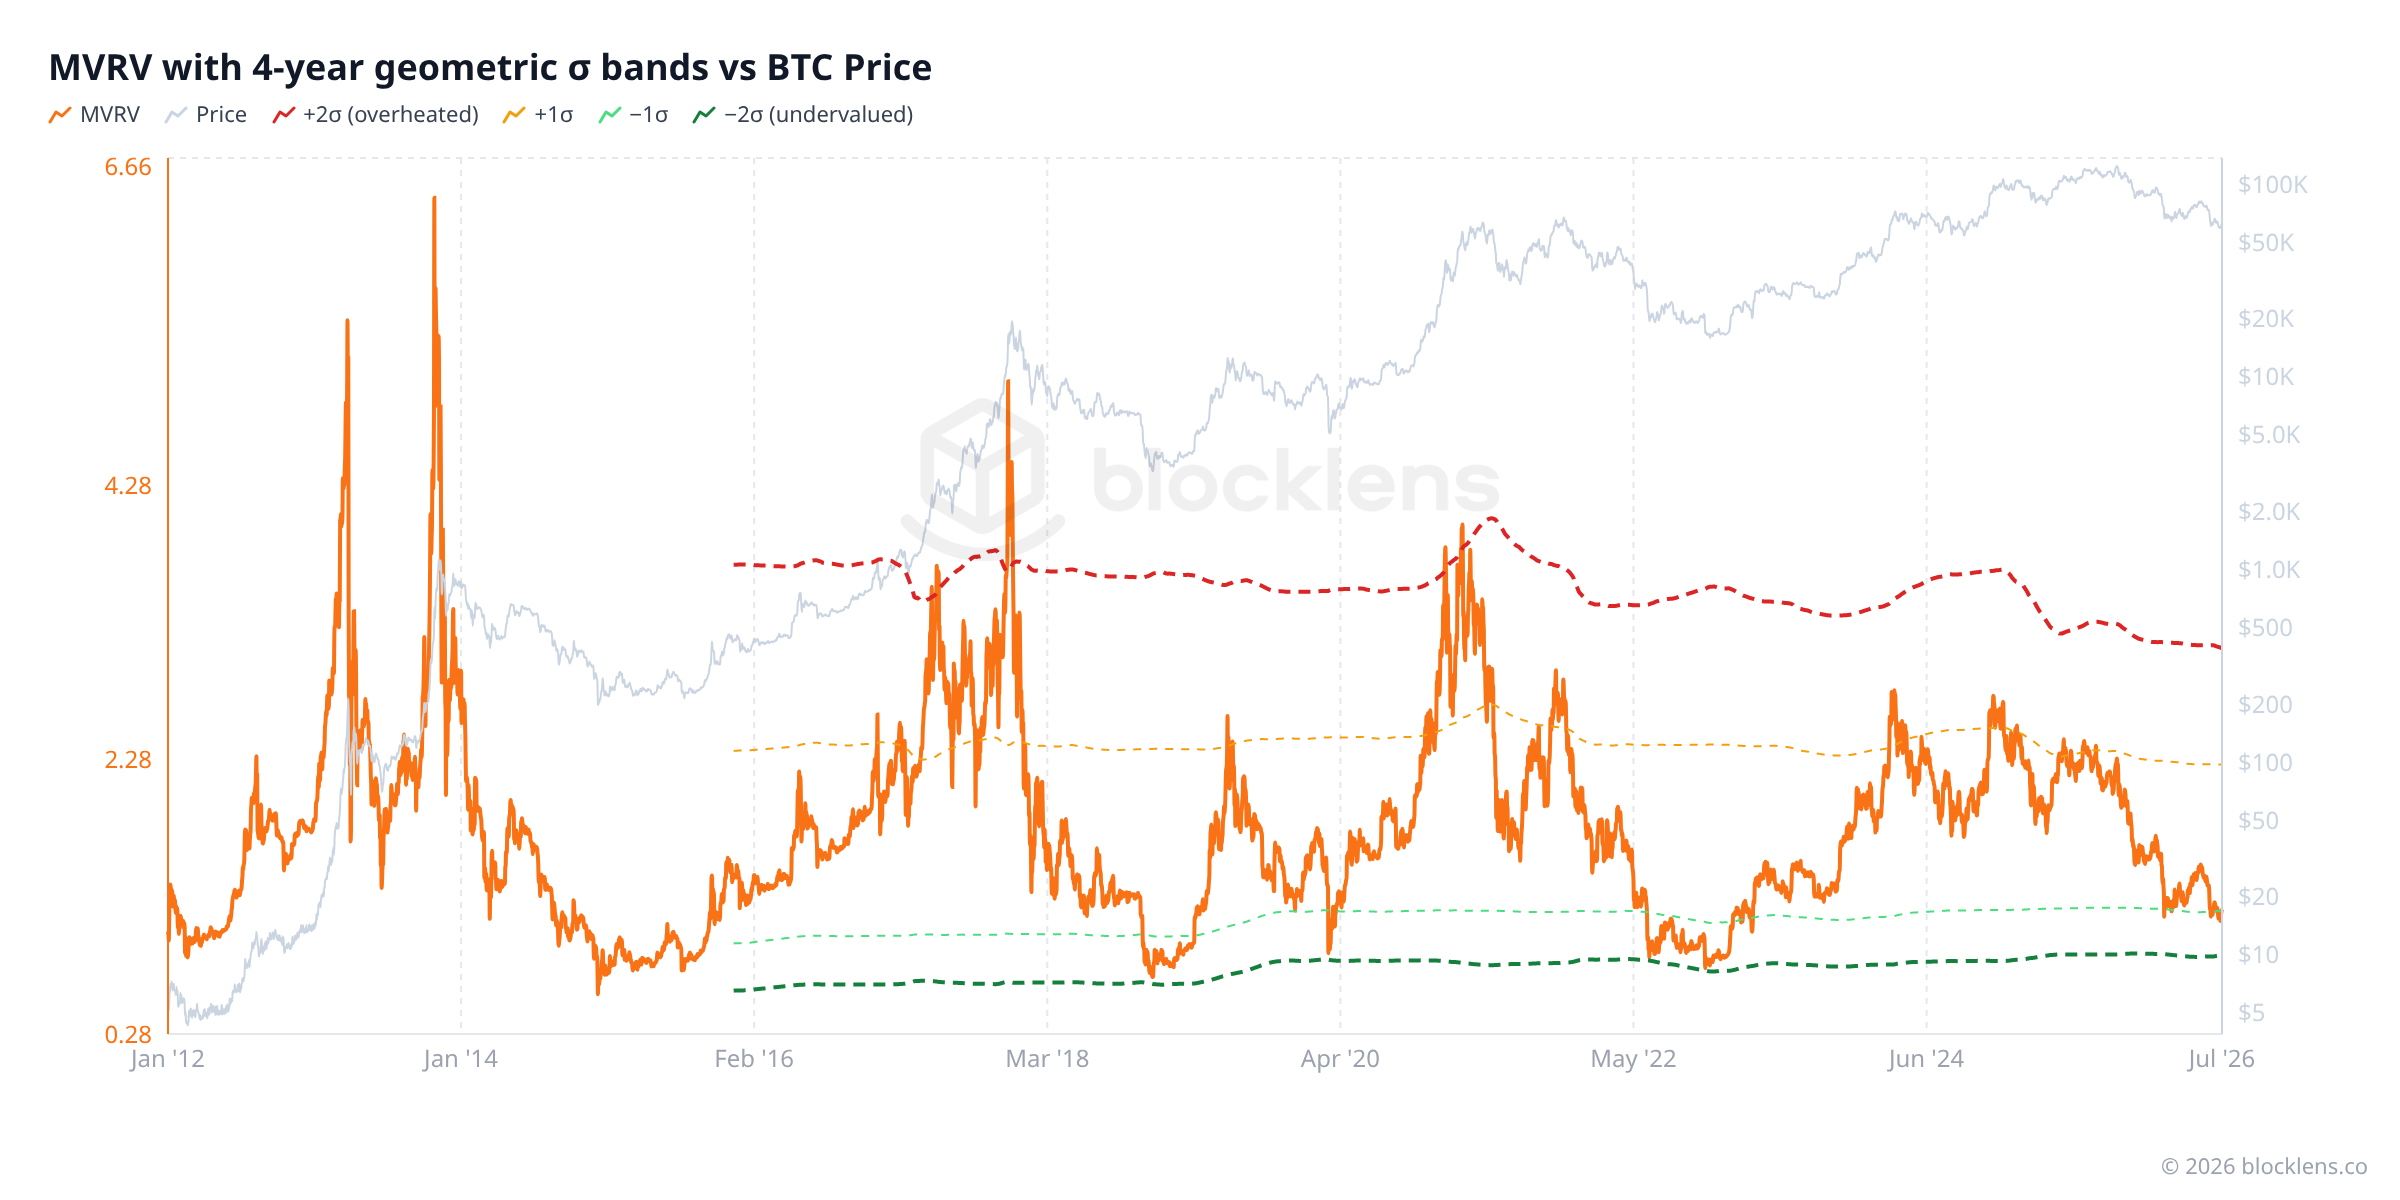
And here is where today's reading gets interesting. A raw MVRV of 1.19 sounds like "mild profit, nothing to see." But put it inside the rails: the four-year geometric average sits at ≈ 1.63, the −1σ floor at ≈ 1.18, and the +2σ ceiling all the way up at ≈ 3.0. MVRV at 1.19 is parked right on the −1σ rail — a full standard deviation below its own four-year norm (a z-score of about −1.0, for those who prefer a single number). Relative to its own recent history, the market is on the cheap side, not the expensive one. Same metric, sharper signal — that is the difference between a generic threshold and analytics that adapt to the market in front of you.
Reality checkWhat the data says today
Let's ground all of this in the current numbers. Here is the MVRV picture for Bitcoin on 4 July 2026:
| Metric | Value | Plain-English meaning |
|---|---|---|
| Market price | ≈ $62,830 | What one bitcoin trades for right now |
| Realized Price | ≈ $53,080 | Network's average cost basis — what everyone paid |
| MVRV | ≈ 1.19 | Market sits ~19% above the aggregate cost basis |
| LTH-MVRV | ≈ 1.27 | Long-term holders are comfortably in profit (+27%) |
| STH-MVRV | ≈ 0.90 | Short-term holders are underwater (−10% on average) |
| Reading | Mild profit regime | Far from >3.5 euphoria of a top; above <1 capitulation of a bottom |
The overall read is calm but not complacent. Aggregate MVRV at 1.19 means the average holder is up about 19% — a comfortable but unremarkable margin. This is nowhere near the kind of extreme that has preceded a cycle top. The "overheated" zone starts around 3.5; price would need to nearly triple from here before that alarm bell rang on aggregate MVRV alone.
At the same time, the STH-MVRV reading of 0.90 tells you that the most recent buyers are carrying real pain. Every rally attempt faces a headwind: holders who bought higher are tempted to "get out even" the moment price approaches their cost basis. That supply overhead is one reason recoveries often feel labored at this stage of a cycle.
Price is also currently about 50% below the all-time high of $126,198 (daily high) set in October 2025 — a significant drawdown that has driven many recent buyers deep into loss territory, even as the older cohort sits comfortably above water. The MVRV split between LTH and STH is a precise quantification of that story.
Key idea
The full MVRV picture today is: mild profit, split market. Patient long-term holders (LTH-MVRV 1.27) are not under pressure. Recent buyers (STH-MVRV 0.90) are. The aggregate ratio (1.19) sits in a zone that historically corresponds to mid-cycle consolidation — past the capitulation bottom, well before the euphoria of a top. Watch for STH-MVRV to reclaim 1.0 as a potential signal of renewed momentum.
Putting it to workThe actionable takeaway
How to use MVRV
Treat MVRV as a risk dial, not a timer. Historically: above ~3.5 the market has been overheated — a zone to take risk off, not add it; below 1 has marked capitulation — the strongest risk/reward to accumulate. Today ≈ 1.19 (mild profit) sits between those extremes. The sharpest tell right now is the cohort split: a recovery in STH-MVRV back above 1 — recent buyers returning to profit — has often preceded the next leg up, while a high LTH-MVRV shows the patient cohort is comfortable and not yet forced to sell.
Caveat: each cycle's MVRV peak has come in lower than the last, so 3.5 is a signpost, not a trigger. One lens among several — not financial advice.
Mini-glossary
- MVRV
- Market Cap ÷ Realized Cap, or equivalently today's price ÷ Realized Price. Measures how far above (or below) the network's average cost basis the current price sits. Values above 1 mean aggregate profit; below 1 mean aggregate loss.
- Market Cap
- Price today multiplied by all coins in circulation. The network's worth "on paper" at today's mood.
- Realized Cap
- Every coin valued at the price it last moved at, then summed. The total money that actually flowed into Bitcoin to put every coin where it is today.
- LTH-MVRV
- MVRV calculated using only the coins held by long-term holders (unmoved for 155+ days) and their own cost bases. Tells you how profitable the patient, experienced cohort is.
- STH-MVRV
- MVRV calculated using only short-term holder coins (moved within the last 155 days). Tells you how profitable — or painful — the most recent market participants are finding their position.
The On-Chain Basics series
- What on-chain analysis is — the cost-basis ledger
- Long-term vs. short-term holders (LTH / STH)
- MVRV in depth — reading "cheap vs. expensive" You are here
- SOPR — what coins reveal the moment they're spent Next
- Realized profit & loss — capitulation and euphoria
- NUPL — the psychology of a market cycle
- Bitcoin's cycles — the halving and the four-year rhythm
- The cost-basis "walls" — reading supply by price