Every Bitcoin holder sits on a paper gain or a paper loss. But paper is just paper. Realized Profit & Loss measures the money that actually changes state — the gains and losses that get locked in the moment a coin moves. It is the difference between watching a portfolio value fluctuate on a screen and a seller pressing the button.
In Part 4 we met SOPR, which tells you how profitable the average coin was when it moved — a ratio above or below 1. In this article we zoom out to the dollar magnitude: how much actual profit (or loss) the entire Bitcoin network is realizing on any given day. This is the metric that puts a price tag on greed and panic.
Paper vs. realUnrealized and realized: two very different things
Imagine you bought one bitcoin at $30,000. The price today is $60,000. You are, in the common phrase, "up $30,000." But that gain does not exist anywhere in the world yet — no money has moved, no wallet has changed, nothing has settled. That is an unrealized gain: a paper profit that lives inside your head (and your portfolio app) until you act.
The moment you sell — or more precisely, the moment that coin moves on the blockchain — the profit becomes realized. $30,000 lands in your wallet (or on an exchange). That money is now in the world. It can be spent, withdrawn, sent somewhere else. It is real.
This distinction matters enormously for reading markets. Unrealized gains create no selling pressure whatsoever. A coin that has been sitting still since 2013 might be showing a 10,000% paper gain, but it is doing nothing to the market. Realized P/L, by contrast, measures the actual flow — money that moved, trades that happened, price impact that was felt in the order books.
Worth knowing
The Bitcoin blockchain lets us calculate unrealized P/L for every coin as well, simply by comparing each coin's cost-basis stamp to today's price. As of 2026-07-04, the aggregate unrealized profit across the whole network is approximately $201 billion — a massive paper gain sitting in long-held coins. But almost none of that is exerting selling pressure today. Realized P/L captures the part that is.
The formulaAdding up the locked-in gains and losses
Every time a coin moves — technically, every time a UTXO is spent — we know two things: the price at which it was originally acquired (its cost-basis stamp from Part 1), and the price at which it was just spent. The difference, multiplied by the amount of bitcoin, is that coin's realized P/L. Sum this across every coin that moved today, and you have the network's total:
$$\text{Realized P/L} = \sum_{\text{spent}} \text{amount} \times \big(\text{price}_{\text{sold}} - \text{price}_{\text{paid}}\big) = \text{LTH Realized P/L} + \text{STH Realized P/L}$$The formula decomposes cleanly into two cohorts — long-term holders (LTH) and short-term holders (STH) — because those groups behave very differently and tell very different stories, as we will see shortly.
A positive result for any given day means the network, in aggregate, sold coins for more than it paid for them — net profit-taking. A negative result means coins moved at a net loss — capitulation. The number can be enormous: at the peak of bull markets, daily realized profit has run into the billions of dollars.
Reading the signalWhat positive and negative values mean
The sign and scale of realized P/L give you a direct window into market psychology:
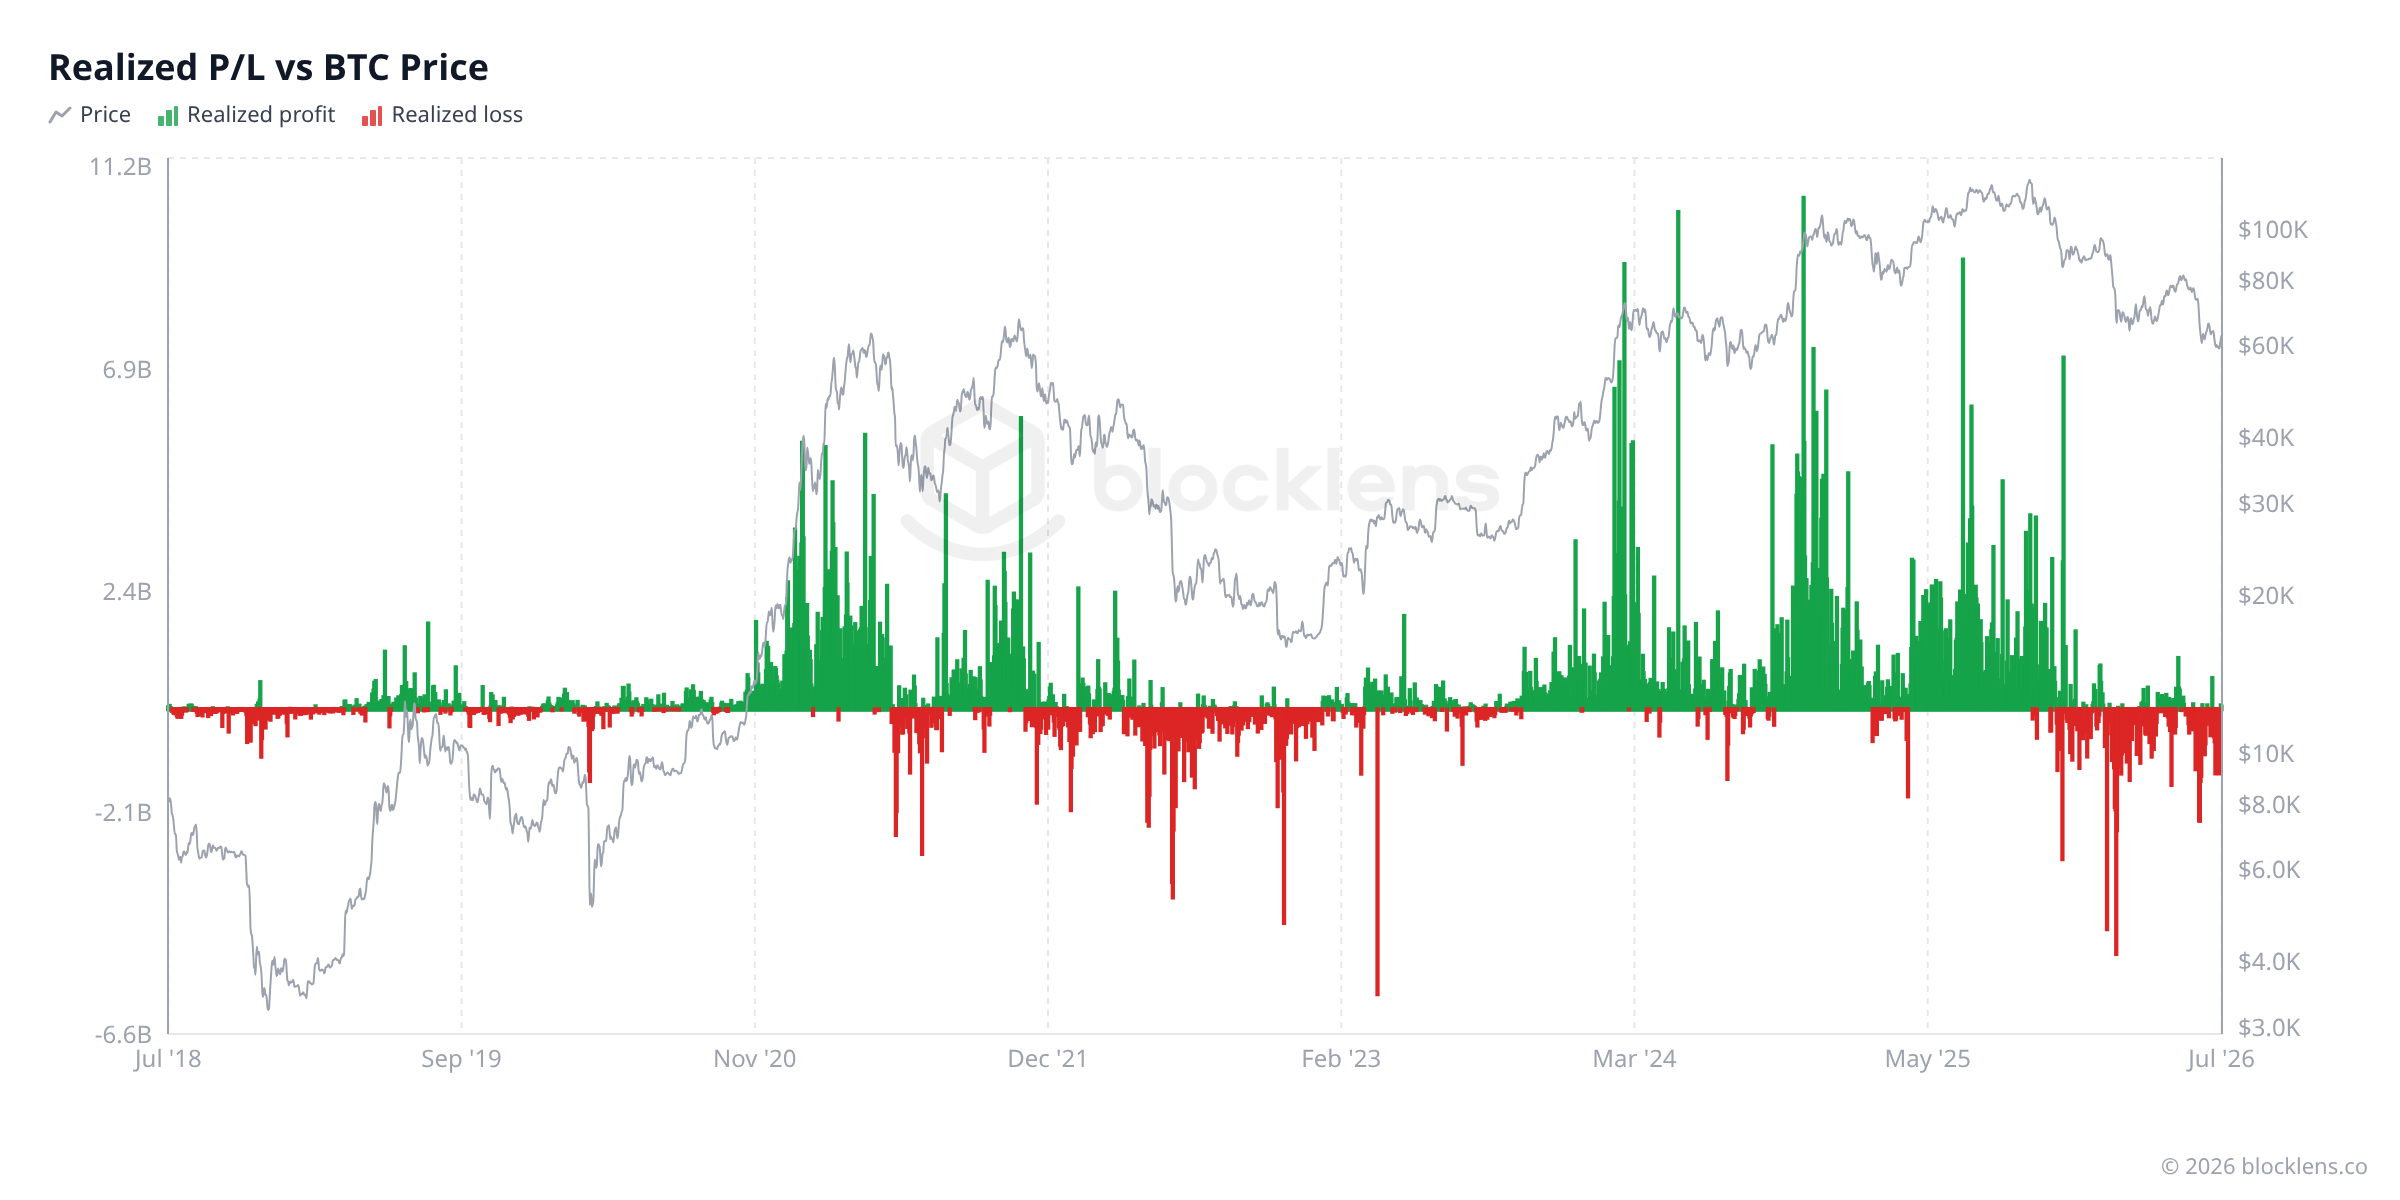
- Large positive values — net profit-taking, sometimes called distribution. Holders are selling into strength. This is common near market tops, when prices are high and long-term winners feel comfortable exiting. Sustained, large positive realized P/L is one of the clearest signatures of a market top in the historical record.
- Large negative values — net loss-taking, sometimes called capitulation. Holders are selling coins that cost them more than the current price, locking in real losses. This is most common near cycle bottoms, when panic or forced selling overwhelms the market. It is painful — and historically one of the best signals that a bottom is near.
- Small values near zero — a quiet market. Not much is moving, or what is moving is changing hands close to its cost basis. This is typical in accumulation phases or periods of low conviction in either direction.
Key idea
The bottom of a Bitcoin cycle is almost always accompanied by a wave of deeply negative Realized P/L — a capitulation flush where sellers lock in real losses at scale. Once the losses are fully absorbed and Realized P/L climbs back toward zero, the market has found its floor. Losers have been washed out; only committed holders remain.
SOPR and Realized P/L togetherThe ratio and the magnitude
If you read Part 4, you know SOPR: the ratio of the price a coin was sold at versus the price it was bought at. A SOPR of 1.05 means coins moved at a 5% profit on average. It is an elegant ratio — but a ratio tells you nothing about scale. A 5% profit on a market moving $1 million a day is very different from a 5% profit on a market moving $5 billion a day.
This is exactly where Realized P/L adds the missing dimension. SOPR tells you how profitable; Realized P/L tells you how much. Use them in combination:
- A high SOPR (say, 1.10) with enormous realized profit (billions per day) is a serious distribution signal. Not only are people selling at a profit — the sheer dollar volume being cashed out is large enough to matter to supply and demand.
- A SOPR just above 1 with modest realized profit is much more benign — mild profit-taking without the kind of volume that historically precedes tops.
- A SOPR below 1 with deeply negative Realized P/L is the clearest capitulation pattern: coins are moving at a loss, and lots of them are doing so at once.
Right now (2026-07-04), SOPR sits at about 1.01 — spending has just crossed back above break-even on the early-July bounce — while net Realized P/L remains mildly negative. These two signals are telling the same story: modest, quiet loss-taking, not a dramatic capitulation event.
Who is selling?LTH vs. STH cohorts reveal everything
The formula above decomposed cleanly into LTH and STH contributions. That decomposition is not just algebraic tidiness — it is one of the most valuable tools in the on-chain analyst's kit, because the two groups sell for entirely different reasons.
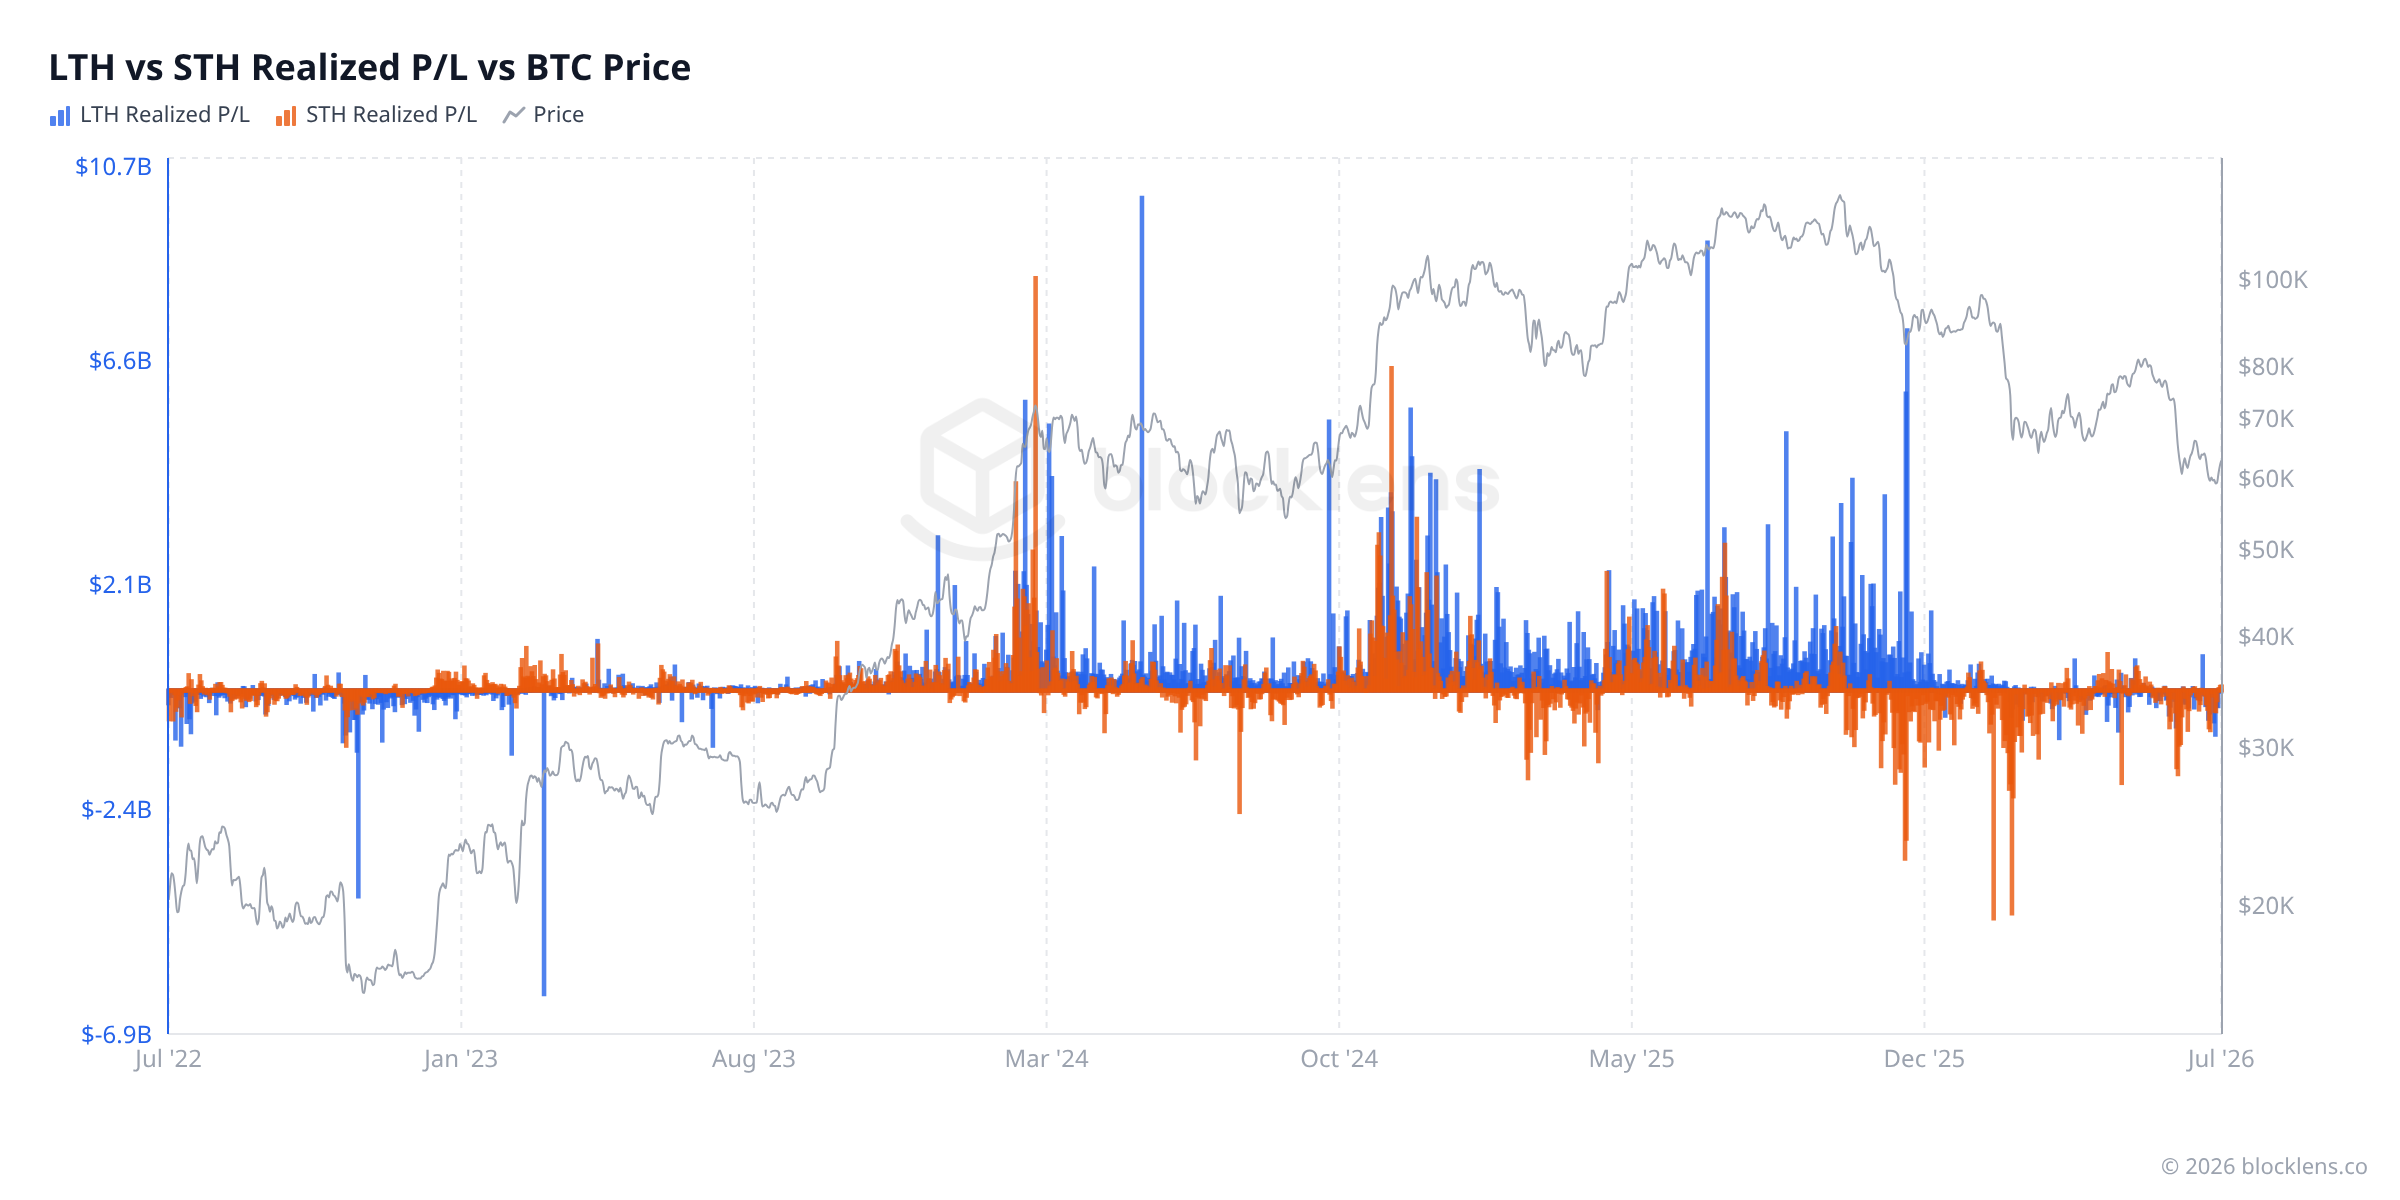
Short-term holders (STH) are coins that last moved within the past 155 days. These are recent buyers — often retail participants who got in during or after the most recent price move. STH realizing losses is a sign of weak hands folding: people who bought high, watched the price fall, and eventually gave up. STH capitulation is painful in real time but often marks the end of the selling pressure from that cohort.
Long-term holders (LTH) are coins that have sat still for 155 days or more. These are the patient, conviction-driven holders — the ones who rode out a full market cycle. LTH realizing profits near a market top is smart money distributing: experienced holders selling into the mania to lock in the gains they have been sitting on for months or years. A spike in LTH realized profit is one of the most reliable late-cycle signals in the on-chain toolkit.
Tier note · PRO
The aggregate Realized P/L series (Figure 1) is available on the free tier of Blocklens. The cohort split you see above — LTH and STH Realized P/L — is a Pro-tier metric, and as this section shows, the split is where most of the signal lives: it tells you who is realizing the gains or the losses.
Worth knowing
The 155-day threshold for LTH vs. STH is not arbitrary — it is approximately the boundary after which coins have historically survived one full major sentiment swing without being sold. Coins that stay put through a bear phase are held by genuinely committed owners. See Part 3 for the full explanation of this threshold and why it matters.
Reality checkWhat the data says today
Let's read the current picture through the Realized P/L lens. As of 4 July 2026:
| Metric | Value | Plain-English meaning |
|---|---|---|
| Market price | ≈ $62,830 | Current BTC price |
| All-time high | $126,198 | Peak daily high (6 Oct 2025); price is ~50% below ATH |
| Net Realized P/L (daily) | Mildly negative | Small net losses being locked in each day |
| SOPR | ≈ 1.01 | Coins moving at a slight average loss — consistent with mild net realized losses |
| Aggregate unrealized profit | ≈ $201B | Paper gains in old, unmoved coins — large but not driving any selling pressure |
| LTH-SOPR | ≈ 0.98 | Long-term holders also moving coins at a slight loss — no large LTH distribution |
| STH-SOPR | ≈ 1.01 | Short-term holders realizing slight losses — weak-hand attrition, not panic |
The story these numbers tell is consistent and quiet. With price roughly 50% below its $126,198 ATH, both cohorts are moving coins at a slight loss — but neither at the scale of a true capitulation event. The $201B in aggregate unrealized profit sits mostly in coins that have not moved in years, held by long-term owners with no apparent urgency to sell at today's price. The market is digesting, not distributing or panicking.
The pattern to watch: if Realized P/L swings sharply positive alongside rising SOPR, long-term holders are beginning to distribute. If it goes deeply negative with SOPR crashing below 0.95, capitulation is underway and a potential bottom is forming.
Putting it to workThe actionable takeaway
How to use Realized P/L
Watch the extremes, not the middle. Deep negative spikes (mass loss-realization) have clustered at cycle bottoms — when they fade back toward zero, the capitulation flush is finishing. Sustained large positive flows (heavy profit-taking) cluster near tops, especially when long-term holders drive them. Today the net sits mildly negative — small losses realized, neither capitulation nor euphoric distribution. Read it with SOPR: high SOPR + big positive Realized P/L = serious distribution; SOPR < 0.95 + deep negative = capitulation.
Caveat: realized flows describe pressure that is already happening, not what comes next. Not financial advice.
Mini-glossary
- Realized P/L (Realized Profit & Loss)
- The sum of all profits and losses locked in when coins move on a given day. Positive = net profit-taking; negative = net loss-taking. Unlike paper gains, these flows are real.
- Unrealized P/L
- The paper profit or loss on coins that are sitting still. Calculated by comparing each coin's cost basis to today's price. It creates no selling pressure until coins actually move.
- Distribution
- A period when holders are selling into strength and locking in profits at scale. Sustained large positive Realized P/L is a distribution signal, especially when driven by long-term holders.
- Capitulation
- A period when holders sell at a loss — often in panic or due to forced liquidations. Deeply negative Realized P/L, especially from short-term holders, is a capitulation signal. Historically coincides with cycle bottoms.
- Cohort attribution
- Splitting Realized P/L (or any on-chain metric) into its LTH and STH components to understand which group is driving the behavior. LTH realizing profits = smart money distributing; STH realizing losses = weak hands folding.
The On-Chain Basics series
- What on-chain analysis is — the cost-basis ledger
- Long-term vs. short-term holders (LTH / STH)
- MVRV in depth — reading "cheap vs. expensive"
- SOPR — what coins reveal the moment they're spent
- Realized profit & loss — capitulation and euphoria You are here
- NUPL — the psychology of a market cycle Next
- Bitcoin's cycles — the halving and the four-year rhythm
- The cost-basis "walls" — reading supply by price