Every bitcoin you see moving on-chain carries a silent confession: the price at which its owner originally acquired it. The moment a coin is sent somewhere — whether to an exchange, a wallet, or a payment — that acquisition price is exposed. SOPR listens to all of those confessions simultaneously and distills them into a single number.
We covered cost basis in Part 1: a coin "remembers" the price it last changed hands at. MVRV (Part 2) and the LTH/STH split (Part 3) used that information in aggregate, across the full supply sitting still. SOPR takes a different slice: instead of looking at coins at rest, it studies coins in motion — specifically, which direction their owners are walking away from the exit door.
The ideaEvery spend is a verdict: profit or loss
Here is a simple example before the formula. Suppose you bought 1 BTC when the price was $40,000. Today the price is $60,000 and you decide to send that coin somewhere. The moment it moves, the blockchain records two facts side by side: the price it was acquired at ($40,000) and the price on the day it just moved ($60,000). The ratio of those two numbers — 1.5 — tells you that the coin left its owner's hands at a 50% profit.
Now repeat that calculation for every single coin that moved on-chain today. Some will come back with ratios above 1 (sold at a profit), some below 1 (sold at a loss), and a handful exactly at 1 (break-even). Weight each by the amount of bitcoin involved and you have SOPR — the Spent Output Profit Ratio.
The formula is:
$$\text{SOPR} = \frac{\sum (\text{amount} \times \text{price at spending})}{\sum (\text{amount} \times \text{price at acquisition})}$$The numerator is the total dollar value of all coins as they leave — what they are worth today. The denominator is the total dollar value of those same coins when they arrived — what their owners originally paid. The ratio tells you whether, on balance, the market is realizing gains or losses right now.
Reading SOPRThree readings and what they mean
Once you know the formula, the three zones of SOPR are easy to remember:
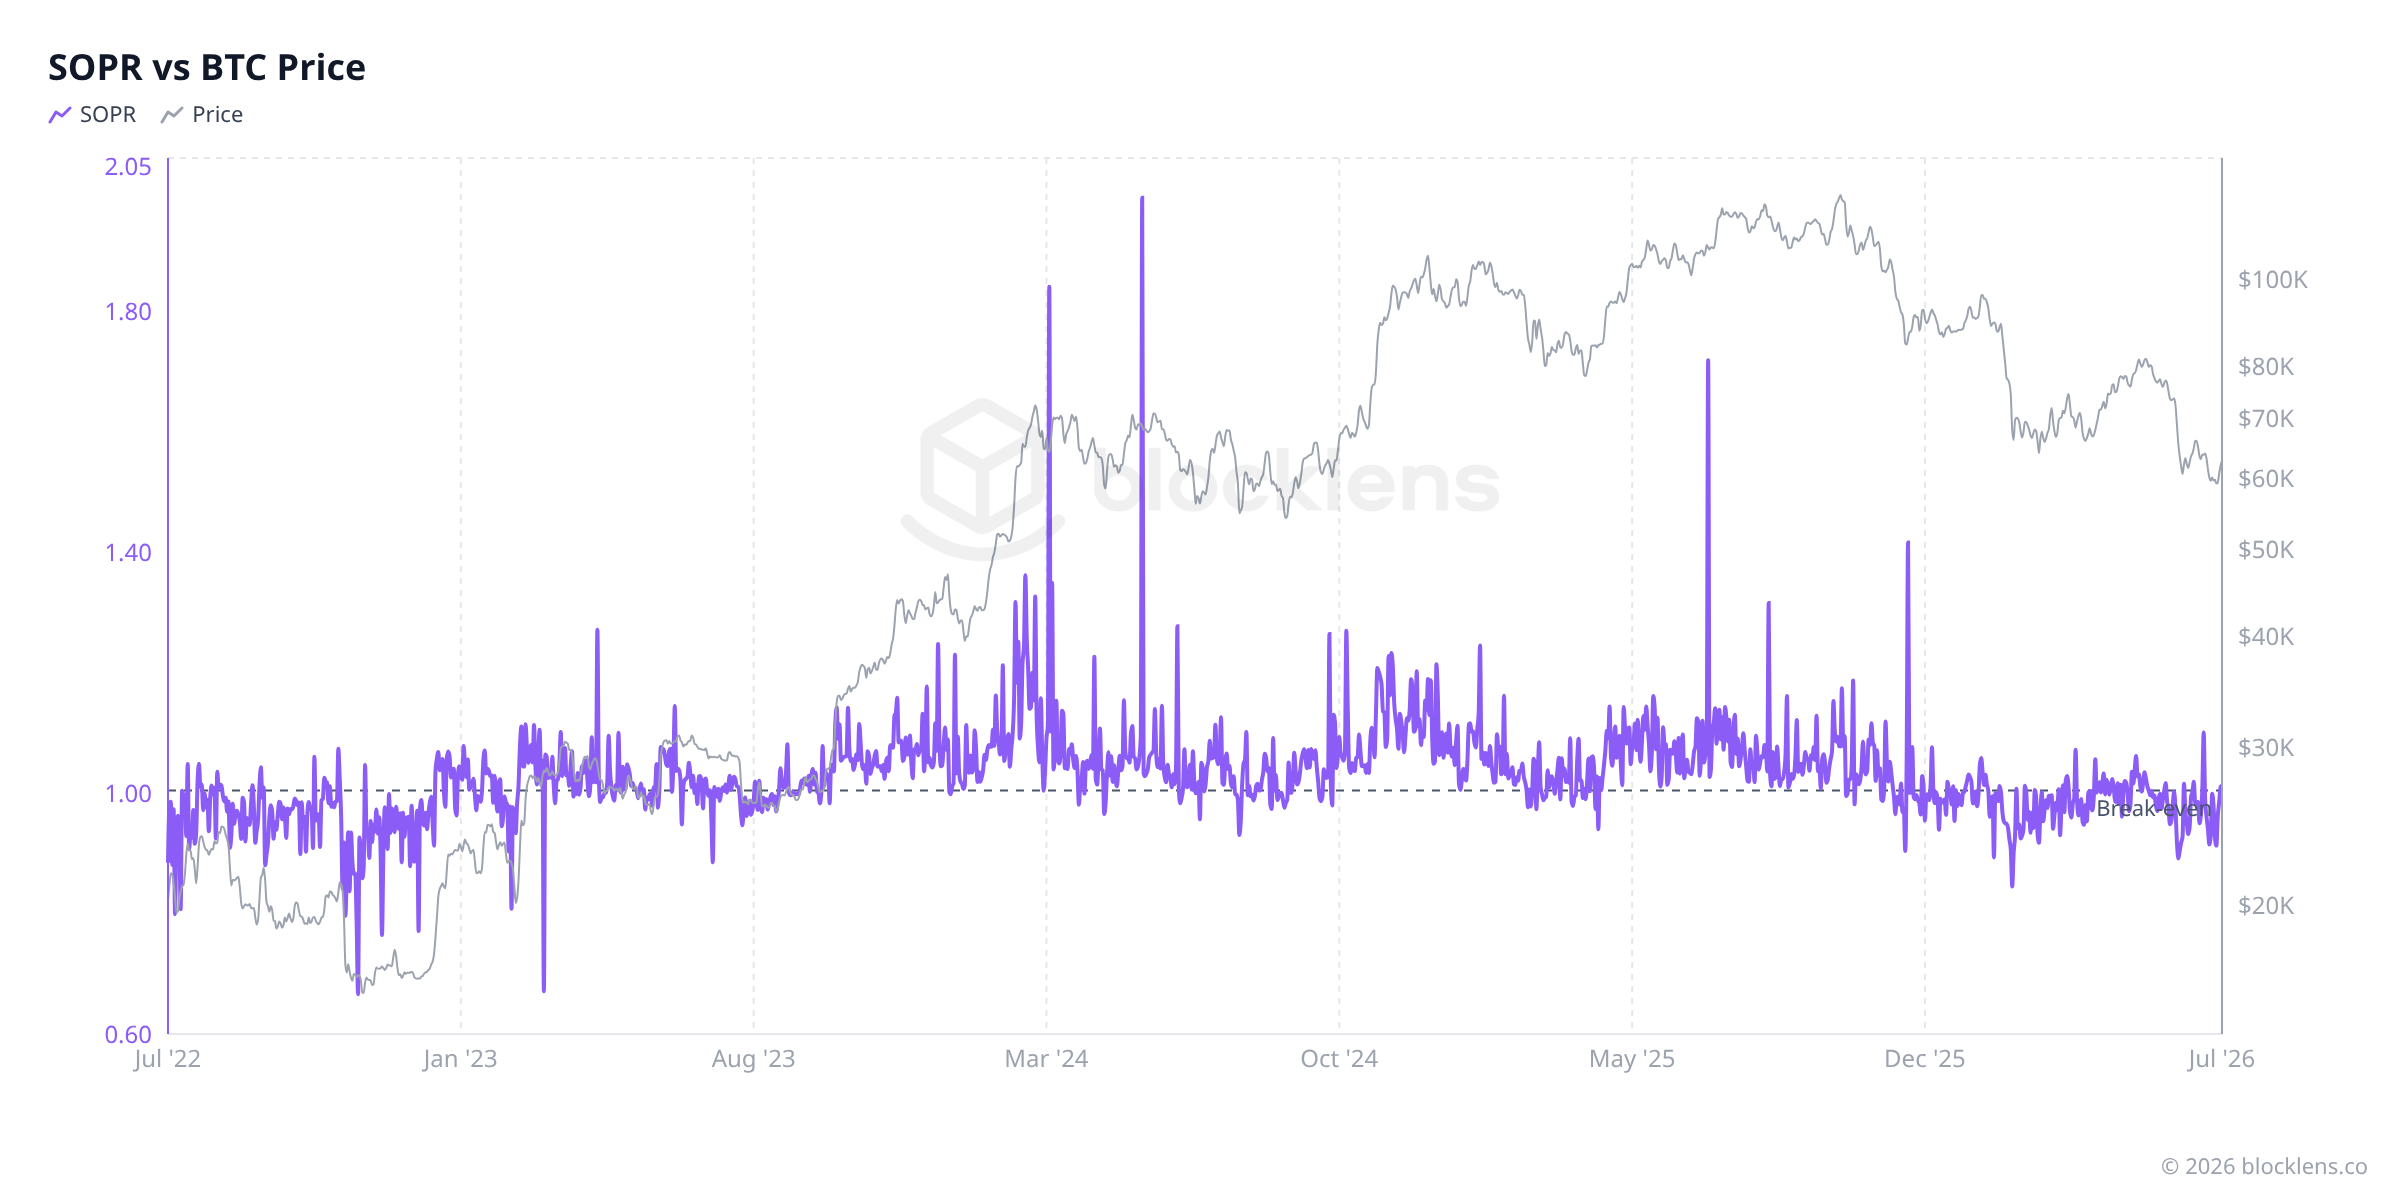
- SOPR = 1 — break-even. Coins are moving out at exactly the same price they moved in. No profit, no loss, in aggregate.
- SOPR > 1 — profit-taking. The coins moving today are worth more than their owners paid. The market is in a healthy bull regime when SOPR stays comfortably above 1 for extended stretches, with sellers pocketing gains rather than dumping in desperation.
- SOPR < 1 — capitulation. Coins are moving out at a loss. Holders who waited through a drawdown have finally run out of patience and are selling below their cost. Sharp, sustained dips below 1 have historically aligned with local bottoms or even cycle lows — the moment when sellers exhaust themselves.
Key idea
The line at 1 is magnetic — and it flips character depending on the regime. In bull markets, SOPR = 1 acts as support: whenever the ratio dips toward break-even, dip-buyers step in and holders refuse to sell at a loss, pushing it back up. In bear markets, SOPR = 1 acts as resistance: sellers who have been waiting to escape at break-even flood the market the moment they get their money back, capping any rally attempt right at that line.
Under the hoodWhy break-even is a psychological fulcrum
There is a straightforward human reason behind that magnetic quality. Imagine holding a coin that has dropped from your purchase price. As long as it sits below what you paid, you are an "unrealized loss" — a number on a screen, not a real outcome yet. Many people can live with that indefinitely, because selling would make the loss real and permanent.
But the instant price recovers to your cost basis, the calculation changes. You can now exit at zero. You've been waiting. You click sell. Multiply that logic by thousands of people who all bought at similar levels and you get a coordinated, rational wall of selling that shows up in the data as SOPR hugging 1 from above, then failing to break through.
That same psychology works in reverse during a bull run. When SOPR dips toward 1 in an otherwise upward market, it signals a brief moment where marginal sellers are taking break-even exits. Buyers who believe in the trend see this as a green light: prices are near the cost of recent purchasers, supply pressure is relatively light, and the dip is likely shallow. SOPR rebounds, and the uptrend resumes.
This is why seasoned analysts watch the SOPR = 1 flip so closely. When a falling SOPR crosses below 1 and stays there — rather than bouncing — it signals a genuine regime shift: people are no longer holding through the pain, and capitulation is setting in.
Who's spending?STH-SOPR and LTH-SOPR: two very different stories
Aggregate SOPR blends all spending together. But we know from Part 3 that short-term holders (STH — coins moved within the last 155 days) and long-term holders (LTH — coins unmoved for at least 155 days) behave very differently. Splitting SOPR along those same lines reveals two instruments with very different sensitivities.
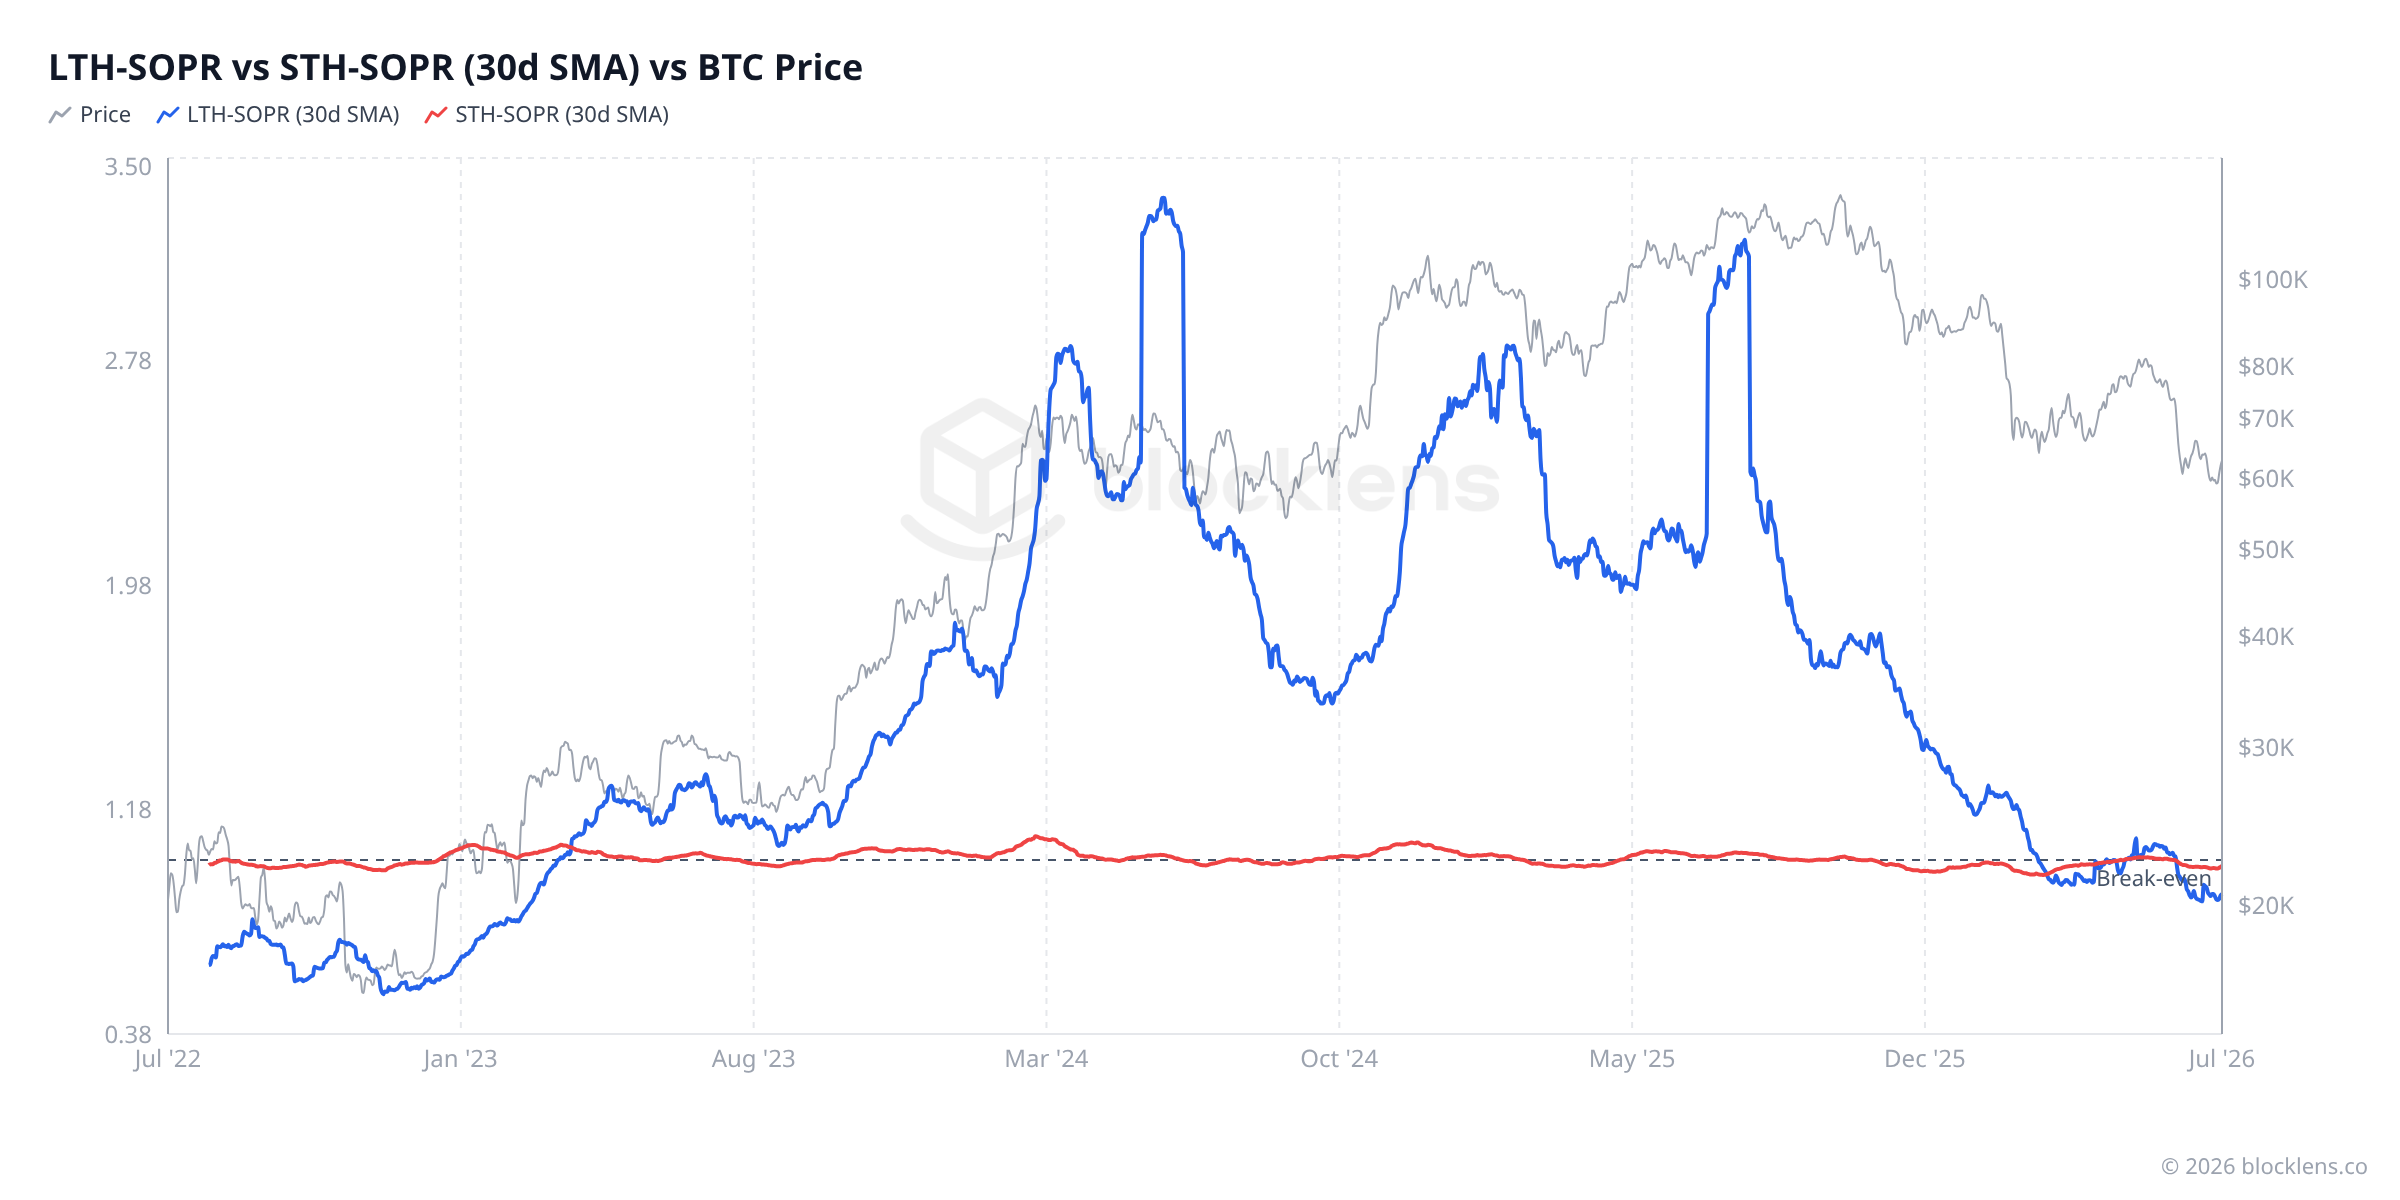
STH-SOPR is the sensitive gauge. Short-term holders account for the bulk of day-to-day spending — they are the most active traders, the recent buyers, the people who are watching the price tick every hour. Their SOPR oscillates quickly around 1, amplifying every dip and rally. When STH-SOPR crashes below 1 sharply, it tends to mark panic among recent buyers: people who bought high and can't take the pain anymore. These are exactly the moments that historically resolve quickly — the weak hands shake out, and the floor firms up.
LTH-SOPR is a rarer signal. Long-term holders rarely move. Their cost basis is usually very low — many bought years ago when bitcoin was a fraction of today's price. When they do move coins, the result can be dramatic: LTH-SOPR spikes well above 1, sometimes to extraordinary levels, because those coins might be worth ten or twenty times what was paid for them. The historical pattern is clear: LTH-SOPR spikes tend to cluster near cycle tops, when seasoned, patient holders finally decide the price is high enough to distribute their holdings.
Together, the two tell a story. STH-SOPR hugging 1 while LTH-SOPR remains quiet suggests the market is in a consolidation or mid-cycle chop — fresh buyers are barely breaking even, but the old hands are not yet selling. LTH-SOPR starting to rise is a very different signal: the patient money is beginning to move.
SOPR is not MVRVWhy you can't derive one from the other
Here is a trap worth defusing. MVRV (Part 2) and SOPR both compare today's price to a cost basis, so it is tempting to think they are two views of the same thing — that you could rearrange one formula into the other. You cannot, and the reason is the single most important idea in this article.
Key idea
MVRV measures a stock; SOPR measures a flow. MVRV is computed over all unspent coins — the entire supply sitting still — and their average cost basis is the Realized Price. SOPR is computed only over the coins spent on a given day — a tiny, self-selected slice in motion. They look at completely different populations, so neither can be recovered from the other.
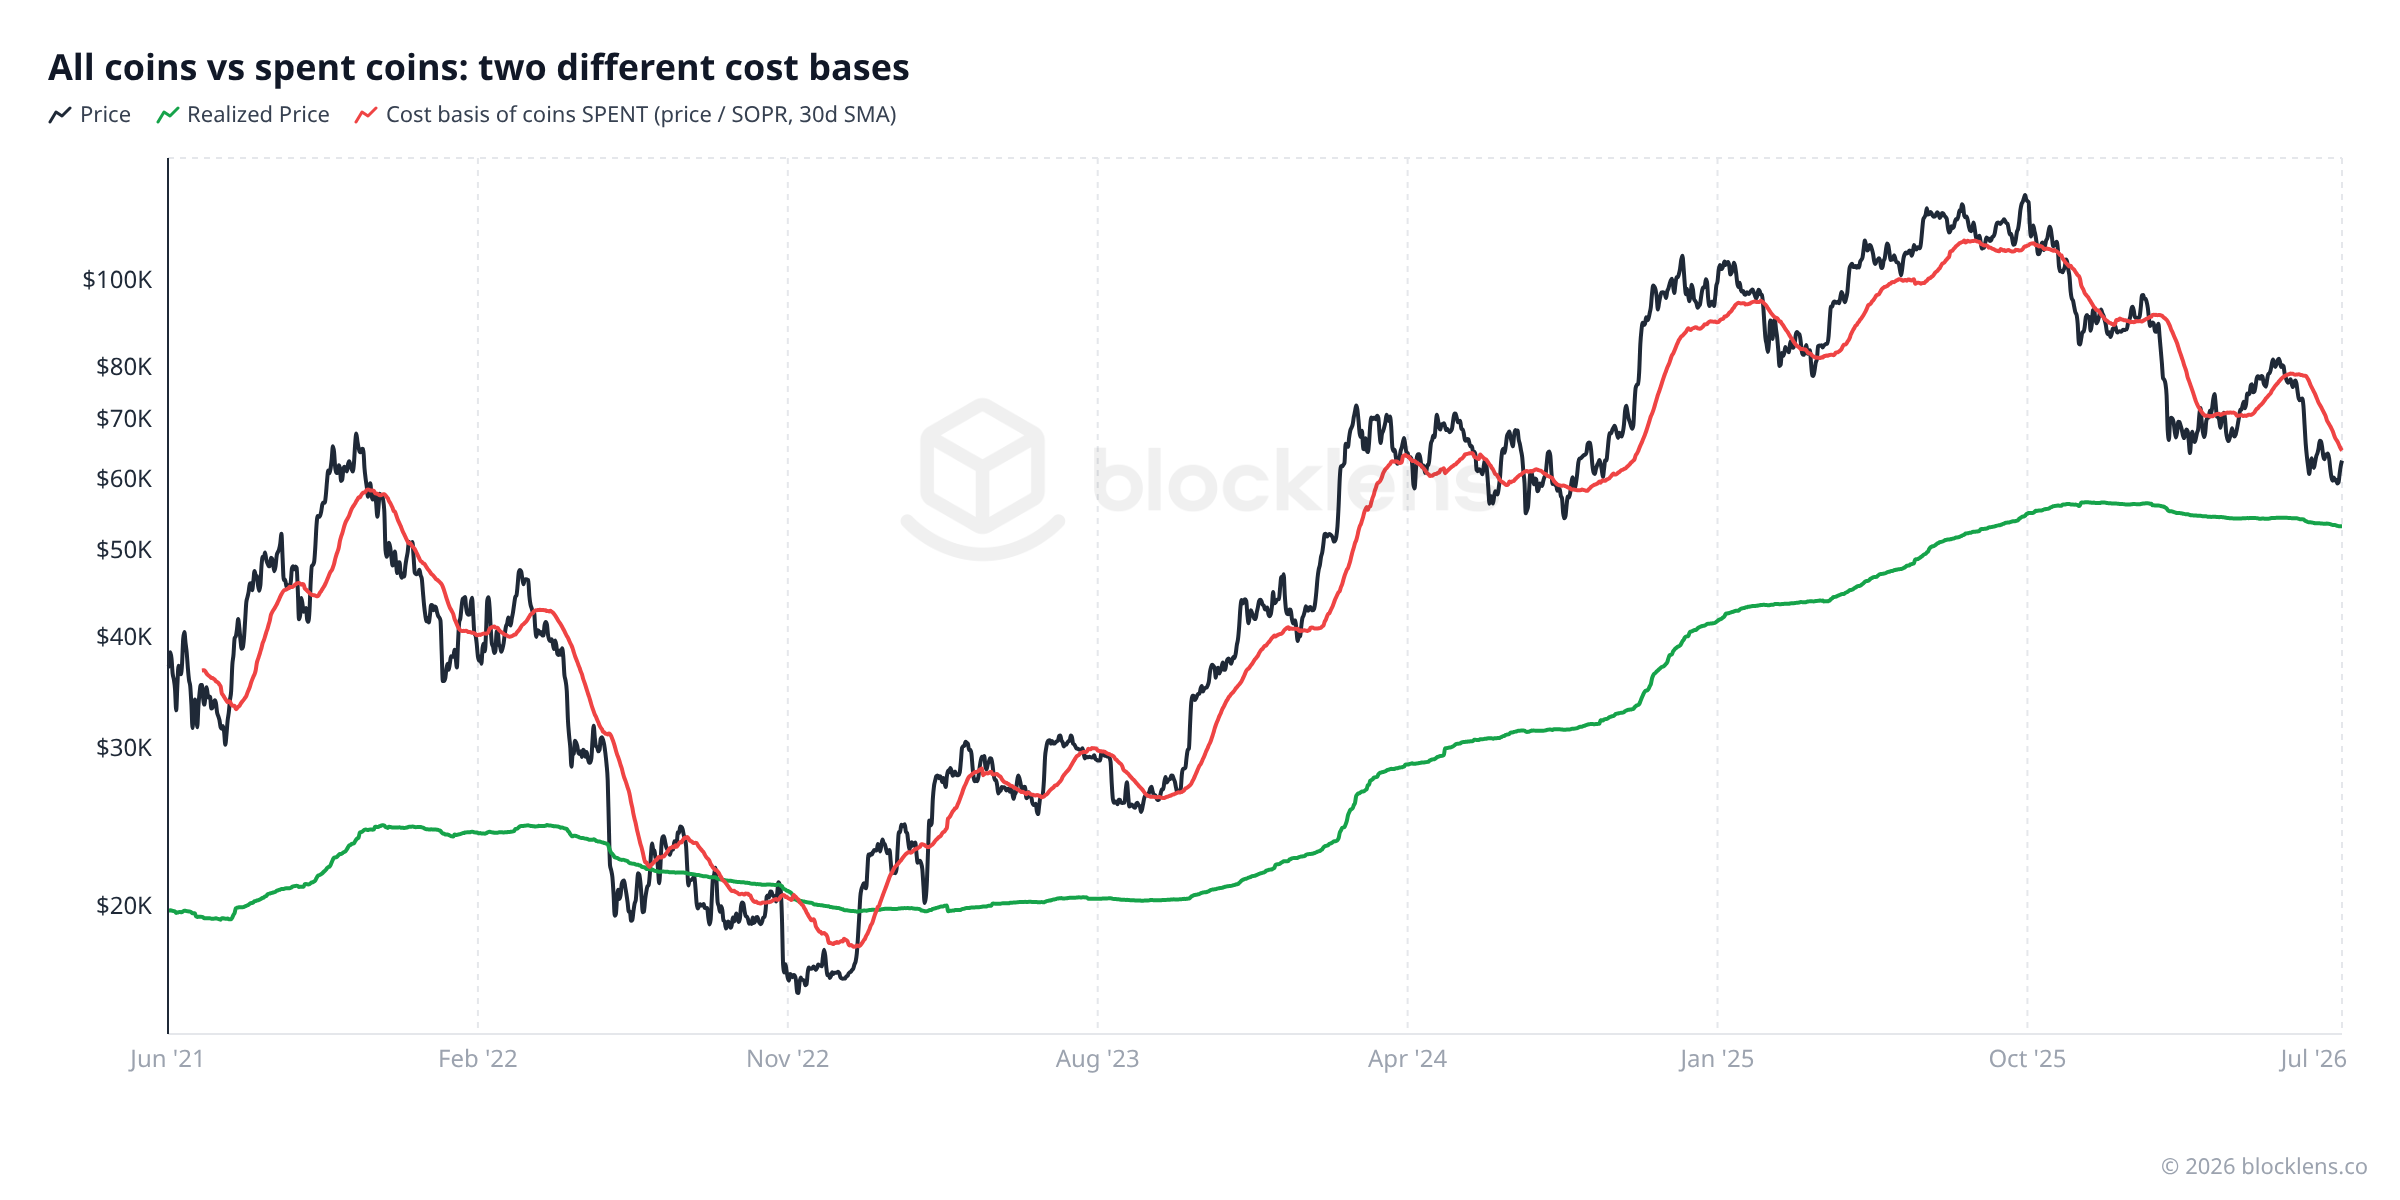
It helps to put both in the same units — dollars of cost basis:
- Realized Price = price ÷ MVRV — the average price paid for every coin in existence.
- "SOPR price" = price ÷ SOPR — the average price paid for only the coins that moved today.
And the two never line up — because the coins that move are a heavily biased slice of all coins, not a representative one. Spending is dominated by recently bought coins (recall the spend-probability power law from Part 3: young coins move far more often), while the oldest, lowest-cost coins — including long-lost supply that will never move again — are almost entirely absent from any day's flow. The cheap end of the cost-basis distribution is missing by construction, so the cost basis of spent coins sits far above the cost basis of all coins, and tracks much closer to recent prices.
A live example: long-term holders in profit, yet selling at a loss
This distinction is not academic — right now it is telling a story that MVRV alone would hide. As of early July 2026:
- The long-term-holder cohort is up about 27%. Its average cost basis (LTH Realized Price) is roughly $49,700, well below the ~$62,830 price — LTH-MVRV ≈ 1.27. By the stock measure, patient money is comfortably in profit.
- Yet the LTH coins actually being sold are deep in the red. LTH-SOPR has sat below 1 on 93 of the last 120 days, and the cost basis of the LTH coins being spent is around $76,500 (30-day SMA) — these are buyers from the 2024–2025 highs whose coins have only just crossed the 155-day line into "long-term holder" territory, and who are now capitulating at a loss of roughly 15–20%.
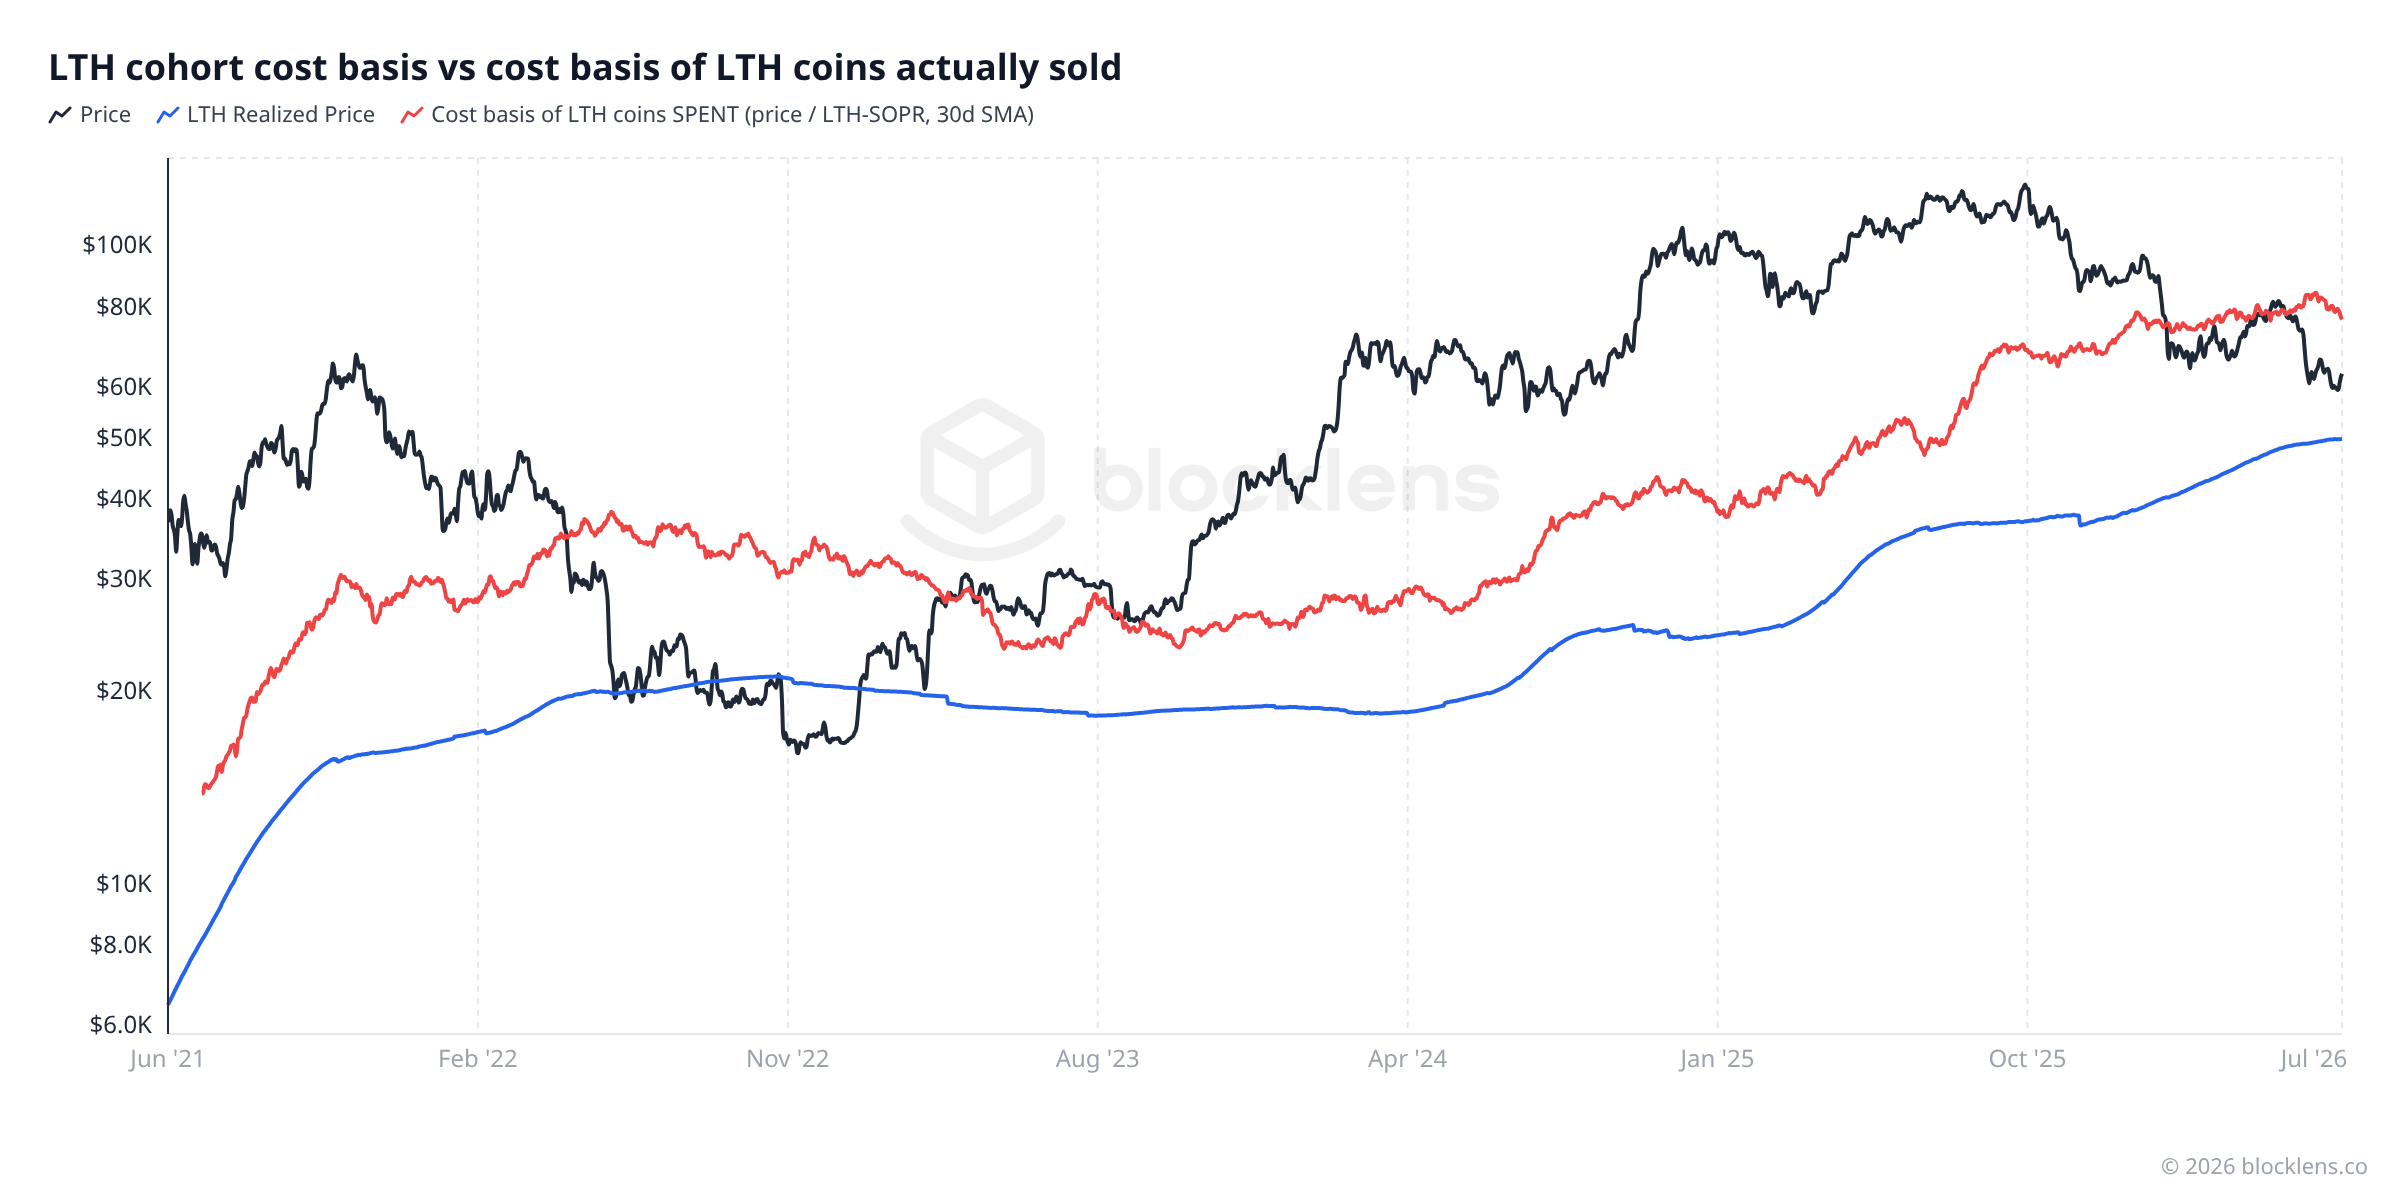
This is the whole point of carrying both metrics. MVRV tells you how the average holder is positioned; SOPR tells you what the marginal seller is actually doing. A cohort can be deeply in profit on paper while the slice of it that chooses to sell is locking in losses — a behavioral signal the stock-based MVRV simply cannot see. When the two disagree, the disagreement is itself the insight.
Built for this — Cohort Spending Analysis · ENTERPRISE
We think SOPR-style spending analysis is one of the most underrated tools in all of on-chain research — most platforms treat it as an afterthought. Blocklens doesn't. That is why we built a dedicated Cohort Spending Analysis dashboard (Enterprise): it lets you slice realized spending across any cohort you define — by age, size, acquisition era, or your own custom segmentation — to see exactly who is selling, at what cost basis, and whether they are realizing gains or losses.
Reality checkWhat the data says today
Let's ground the theory in live numbers from 4 July 2026.
| Metric | Value | Plain-English meaning |
|---|---|---|
| SOPR (all coins) | ≈ 1.01 | Coins moved today are worth ~0.5% less than their owners paid — slight aggregate loss |
| LTH-SOPR | ≈ 0.87 | This single day; the daily reading is noisy, but on a 30-day view LTH-SOPR runs near 0.88 — a persistent loss (see the cost-basis split above) |
| STH-SOPR | ≈ 1.01 | Short-term holders are barely in the red — a hair below break-even |
| BTC price | ≈ $62,830 | About 50% below the all-time high of $126,198 (daily high, 6 Oct 2025) |
The three SOPR readings now straddle the break-even line — and the split is the story. Aggregate SOPR (≈ 1.01) and STH-SOPR (≈ 1.01) have just poked back above 1 on the bounce from the 1 July low near $57,750: recent buyers are exiting at their cost as price recovers — classic break-even selling into a relief rally. LTH-SOPR (≈ 0.87), by contrast, remains far below 1: the long-term holders who are moving coins are still locking in double-digit losses. The market sits roughly 50% below its all-time high, and the cohort under the most pressure is still working through its positions.
The fact that LTH-SOPR (≈ 0.87) sits so far below STH-SOPR (≈ 1.01) is worth noting. It suggests that some long-term holders who accumulated later in the bull run — perhaps in mid-2025 — are also underwater and beginning to move coins at a loss. This is subtly different from the usual LTH pattern of moving coins deep in profit near a top. It is consistent with a cycle in the aftermath phase rather than an active distribution phase.
Worth knowing · PRO
SOPR — including its LTH and STH variants — is a Pro-tier metric on Blocklens: a core, widely-used indicator with a long and well-studied track record, available on any Pro account. It pairs naturally with Realized Profit & Loss, which is the subject of the next article in this series. Think of them as two sides of the same coin: SOPR is the ratio (how far above or below cost are coins moving?), while Realized P&L is the dollar amount (how many dollars of gain or loss are actually being locked in each day?). Together they give you both the direction and the scale of what the market is feeling.
Putting it to workThe actionable takeaway
How to use SOPR
The whole signal lives at the value 1. In an uptrend, SOPR dipping to 1 and bouncing means dip-buyers are defending break-even — a level to accumulate into. In a downtrend, SOPR repeatedly failing at 1 means break-even sellers are capping rallies, so wait for a decisive hold above 1 before trusting a recovery. Sharp STH-SOPR plunges well below 1 mark moments of maximum pain that have often coincided with local bottoms. Today ≈ 1.01: spending has just crossed back above break-even on the bounce off the 1 July low — watch whether it holds above 1 (recovery gaining traction) or is rejected again (break-even sellers still in control).
Caveat: SOPR confirms what is happening, it does not forecast — pair it with Realized P/L (next article) for the dollar scale. Not financial advice.
Mini-glossary
- SOPR
- Spent Output Profit Ratio. The ratio of the value of all coins spent today to the value of those same coins when they were last acquired. Above 1 = profit realized; below 1 = loss realized.
- Spent output
- A coin (technically a UTXO) that has been moved on-chain — sent from one address to another. At the moment of spending, both its acquisition price and its current price are knowable.
- Cost basis
- The price a coin was last acquired at. This is what the denominator of SOPR is built from — it records what the current holder effectively paid.
- Break-even (SOPR = 1)
- The point where coins are being moved at exactly the price they were acquired. Neither a profit nor a loss is realized on aggregate. This level acts as support in bull markets and resistance in bear markets.
- STH-SOPR
- SOPR calculated only for coins that were last moved within the past 155 days (short-term holders). Reacts quickly to price changes; useful for spotting near-term capitulation events.
- LTH-SOPR
- SOPR calculated only for coins unmoved for at least 155 days (long-term holders). Usually quiet, but spikes dramatically when patient, low-cost holders finally sell — a pattern historically associated with late bull-market distribution.
The On-Chain Basics series
- What on-chain analysis is — the cost-basis ledger
- Long-term vs. short-term holders (LTH / STH)
- MVRV in depth — reading "cheap vs. expensive"
- SOPR — what coins reveal the moment they're spent You are here
- Realized profit & loss — capitulation and euphoria Next
- NUPL — the psychology of a market cycle
- Bitcoin's cycles — the halving and the four-year rhythm
- The cost-basis "walls" — reading supply by price