You have already met MVRV: the ratio that tells you how far the market's current price sits above (or below) what everyone paid. NUPL takes that same gap and answers a slightly different question: what fraction of the entire network's market cap is pure unrealized profit? The answer turns out to be one of the most intuitive mood gauges in all of on-chain analysis.
NUPL stands for Net Unrealized Profit/Loss. The "net" is the key word. It looks at all the coins currently sitting in profit, subtracts all the coins currently sitting in a loss, and expresses what's left as a share of the total market cap. When the whole network is deeply in profit, greed and euphoria dominate. When the whole network is underwater, fear and capitulation take hold. NUPL puts a number on that mood.
The formulaFrom cap math to a mood score
Start with what you know: Market Cap is the value of every coin at today's price, while Realized Cap is the value of every coin at the price it was last paid. Their difference — Market Cap minus Realized Cap — is the total unrealized profit (or loss) sitting across the entire network right now.
Divide that by Market Cap to get a fraction, and you have NUPL:
$$\text{NUPL} = \frac{\text{Market Cap} - \text{Realized Cap}}{\text{Market Cap}} = 1 - \frac{1}{\text{MVRV}}$$Both forms say the same thing. The first is the definition — aggregate unrealized profit as a share of market cap. The second shows you why NUPL and MVRV are really the same signal in different clothes: NUPL is just 1 minus the reciprocal of MVRV. If MVRV is 1.19 today, then NUPL is \(1 - \frac{1}{1.19} \approx 0.159\). Same information, different units.
The result is a number that, for the network as a whole, has historically lived between roughly −0.5 and +0.75 — though as we'll see below, the scale is not symmetric:
- NUPL = 0 means Market Cap equals Realized Cap — aggregate profit is exactly zero. The network is, on net, at breakeven.
- NUPL > 0 means the network holds net unrealized profit. The higher, the richer — and typically the more complacent — the crowd feels.
- NUPL < 0 means the network is sitting on net unrealized losses. Holders are hurting. That pain is what analysts call capitulation territory.
The emotion bandsWalking up the mood ladder
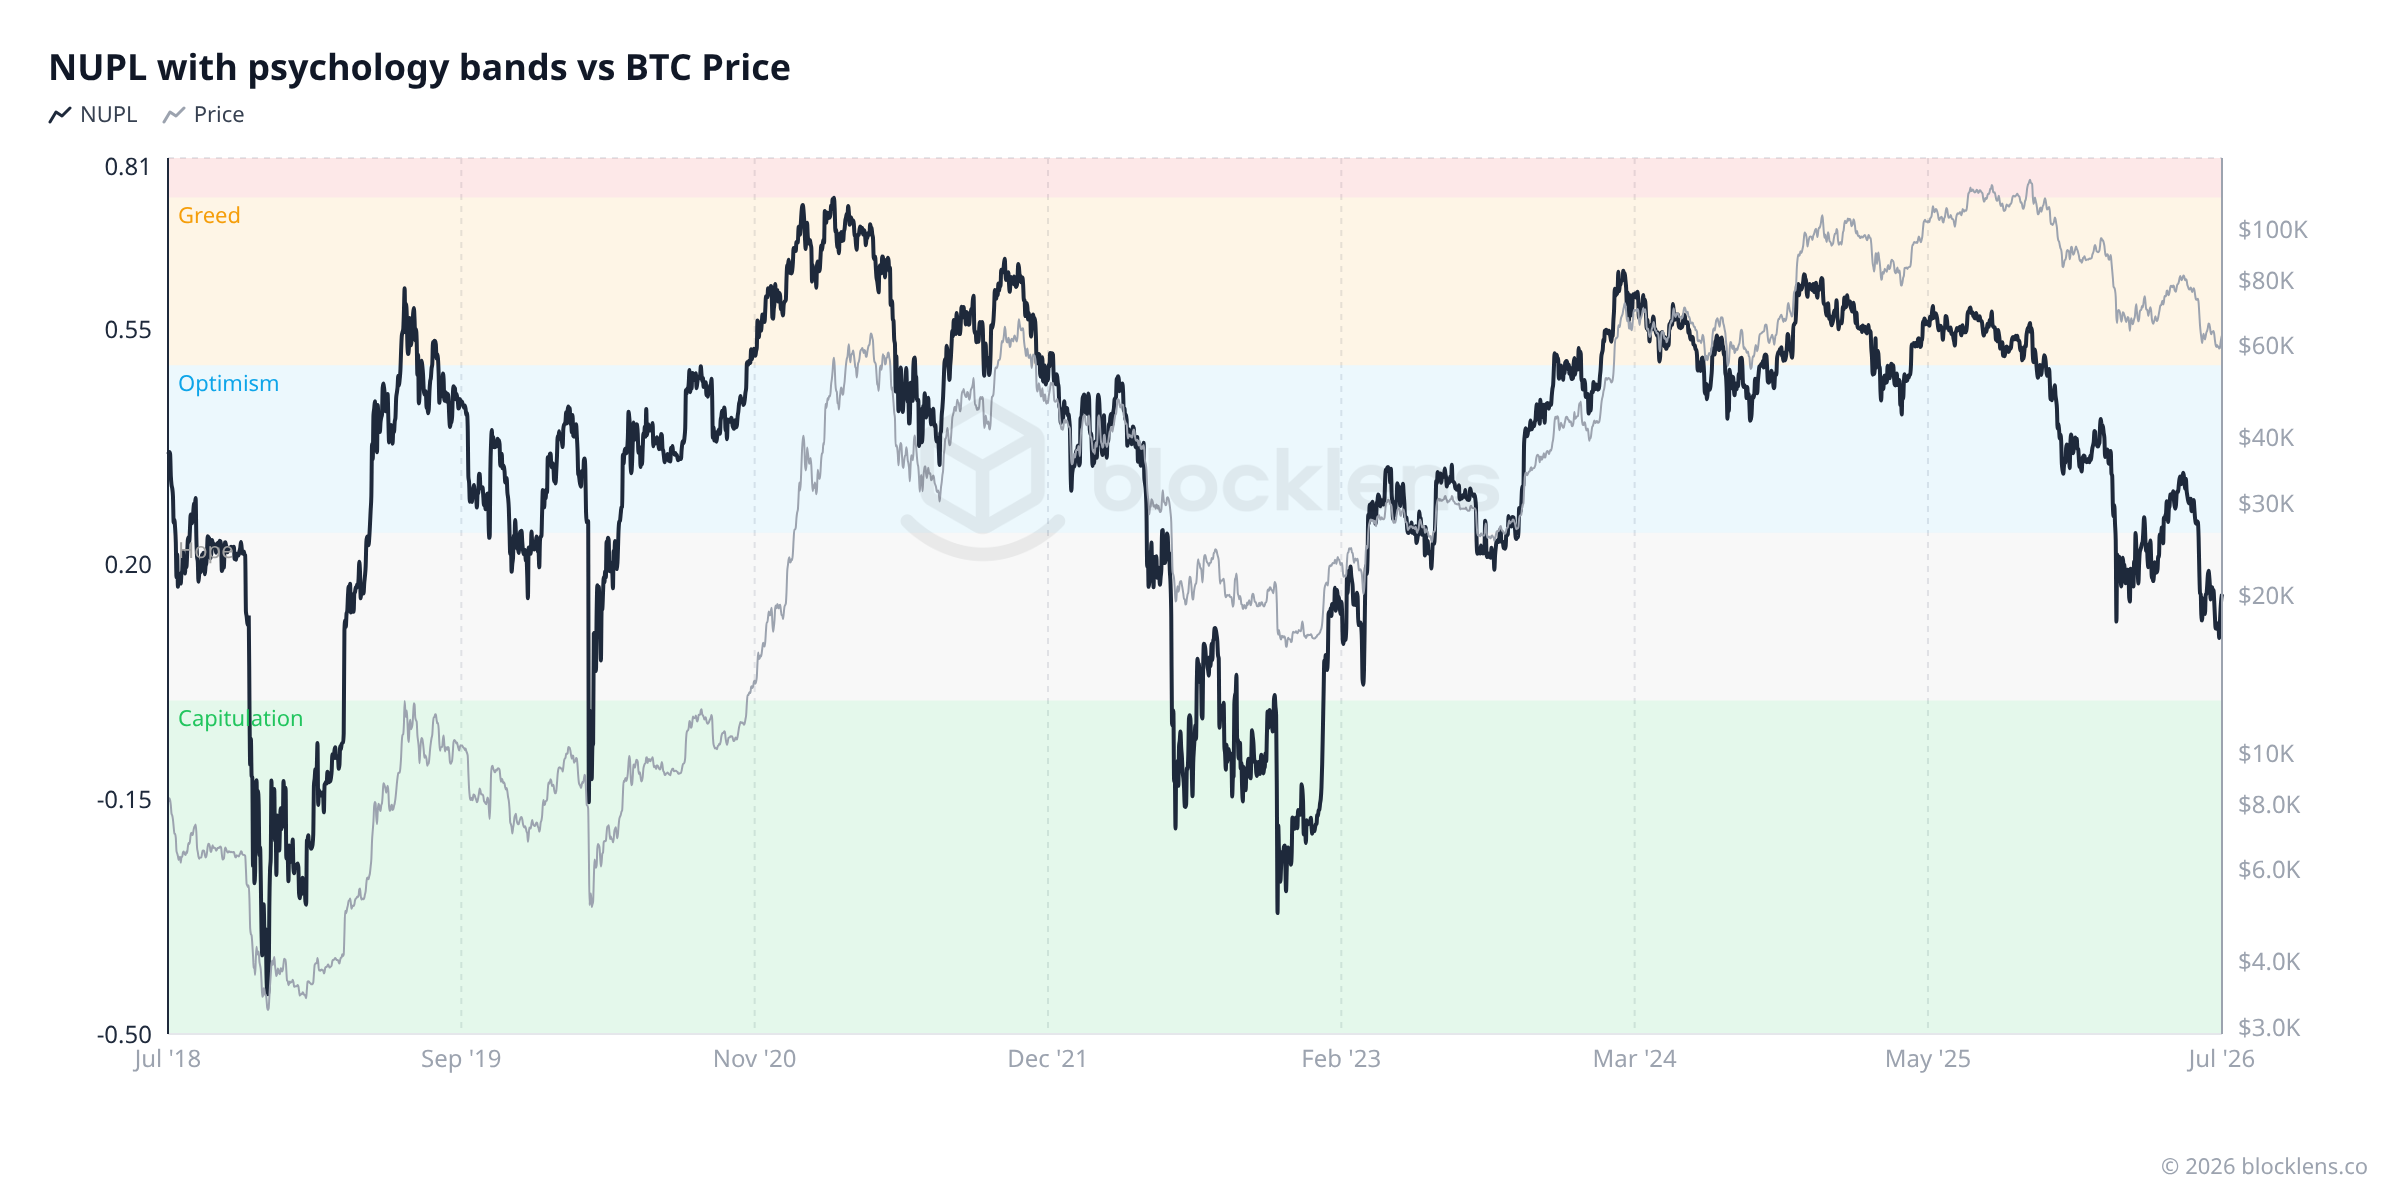
NUPL's real power is not the number itself — it's what researchers have observed the crowd tends to feel at different levels. Over multiple market cycles, five distinct emotional regimes emerge, stacked like floors of a building. Let's walk up from the basement.
Capitulation / Fear — NUPL below 0
When NUPL turns negative, the average unit of Bitcoin is worth less than what it cost. Enough holders are sitting on losses that it outweighs the profit of everyone else. This is the gut-punch zone. Sentiment is dark. Selling at a loss becomes common — sometimes forced. Historically, NUPL spending meaningful time below zero has coincided with the deep troughs of bear markets: late 2018, March 2020, late 2022. For long-term investors, these are the moments the data has consistently flagged as generational accumulation opportunities.
Hope / Anxiety — NUPL 0 to 0.25
The network has clawed back into positive territory, but only barely. The aggregate holder is slightly in profit, yet the memory of recent pain is fresh. Anxiety lingers — has the bottom really passed? This is often the quietest, most uncertain part of an early recovery. Price tends to drift, sentiment is cautious, and it's easy to miss that the floor has already been set. NUPL in this band characterizes the early stages of a new bull market just as often as the late stages of a slow bleed.
Optimism — NUPL 0.25 to 0.5
Profits are building meaningfully. More and more participants are clearly "in the green." Confidence is growing. News coverage picks up. This is the comfortable middle of a bull run: not complacent yet, but no longer anxious. It's the phase that tends to attract new participants who missed the early move — which is precisely what pushes NUPL higher.
Greed — NUPL 0.5 to 0.75
The crowd is sitting on substantial profits and starting to believe this time really is different. Greed replaces optimism. Leverage builds. Social media lights up. This is the late-bull environment where the majority of participants feel brilliant — and where the seeds of the next downturn are usually being quietly planted. Distribution often begins here, as early holders and institutions start to lighten up.
Euphoria — NUPL above 0.75
The top floor. The network is awash in unrealized profit, and the crowd's psychology has crossed from greed into something closer to mania. "Number go up" feels inevitable to most participants. Historically, every major Bitcoin cycle top — 2013, 2017, 2021 — was marked by NUPL pushing above 0.75 before rolling over. This is the zone where on-chain analysts get cautious, because it is precisely when the crowd feels most certain that the risk is highest.
Key idea
NUPL is MVRV's twin — the equation \(1 - \frac{1}{\text{MVRV}}\) makes that exact. What NUPL adds is a human-readable scale: instead of asking "is MVRV high or low?", you can ask "which emotion band are we in?" The information is identical; the framing is more intuitive for gauging crowd psychology at a glance.
One chart, five moodsSeeing the bands across cycles
LTH vs STHThe split that tells the real story
Aggregate NUPL is useful, but it can hide a crucial fault line between two very different groups of participants. We can calculate NUPL separately for long-term holders — coins that haven't moved in 155 days or more — and short-term holders — coins that changed hands within the past 155 days.
Right now, those two groups are living in opposite worlds.
LTH-NUPL ≈ +0.21. Long-term holders are in modest profit. These are the people who accumulated during the bear market, or who held through the correction from the $126,198 all-time high. Their patience has been rewarded with a cushion — not a windfall, but they are solidly in the green. Their psychology is calm. They can hold.
STH-NUPL ≈ −0.11. Short-term holders — people who bought relatively recently, many of them near recent highs — are underwater. Their cost basis is high (around $69,700 on average), and today's price around $62,830 means most of them are sitting on an unrealized loss. This is the group under pressure. When NUPL is negative for recent buyers, it historically correlates with fragile sentiment and elevated selling risk: holders in pain have a strong incentive to cut their losses if price dips further.
This LTH/STH divergence is one of the most informative readings the metric offers. When LTH-NUPL is positive and STH-NUPL is negative, the market is in a kind of standoff: experienced, patient money is comfortable, while newer money is anxious. The outcome often depends on which group blinks first.
The asymmetryWhy NUPL shines in drawdowns — and how traders use STH-NUPL
There is a structural feature of NUPL that most explanations never mention, and it changes how you should use the metric. Look at the formula again: \(\text{NUPL} = 1 - \frac{1}{\text{MVRV}}\). Because MVRV can never fall below zero but can rise without limit, NUPL is capped at 1 on the upside — but unbounded on the downside. No matter how euphoric the market gets, NUPL only creeps asymptotically toward 1; but in a crash, it can fall to −0.5, −1, or beyond, with nothing to stop it.
The practical consequence: the scale is compressed near the top and stretched near the bottom. Up in the Greed and Euphoria bands, big changes in market conditions produce only small movements in NUPL — the metric saturates. But below zero, every additional point of pain registers in full. That gives NUPL its finest resolution exactly where drawdowns live, which makes it better suited to analyzing corrections and bottoms than to timing tops.
Key idea
NUPL is bounded above by 1 but unbounded below — so its signal is sharpest in negative territory. Use the euphoria bands for slow, cycle-scale orientation; use the drawdown side of NUPL when you need precision about how much pain the market is actually in.
This is also where NUPL stops being a purely macro tool and becomes useful on shorter horizons — tracking faster swings in profitability to find entry points in active trading. For that job, the aggregate reading is too slow: it is dominated by old, immobile coins. The version to watch is STH-NUPL — the unrealized profit and loss of short-term holders only. This cohort bought recently, near current prices, so its NUPL swings hard with every move — and when it plunges deep below zero, it flags a local exhaustion of the short-term cohort: the recent buyers who were going to capitulate largely have, selling pressure is spent, and the market becomes spring-loaded for a relief move.
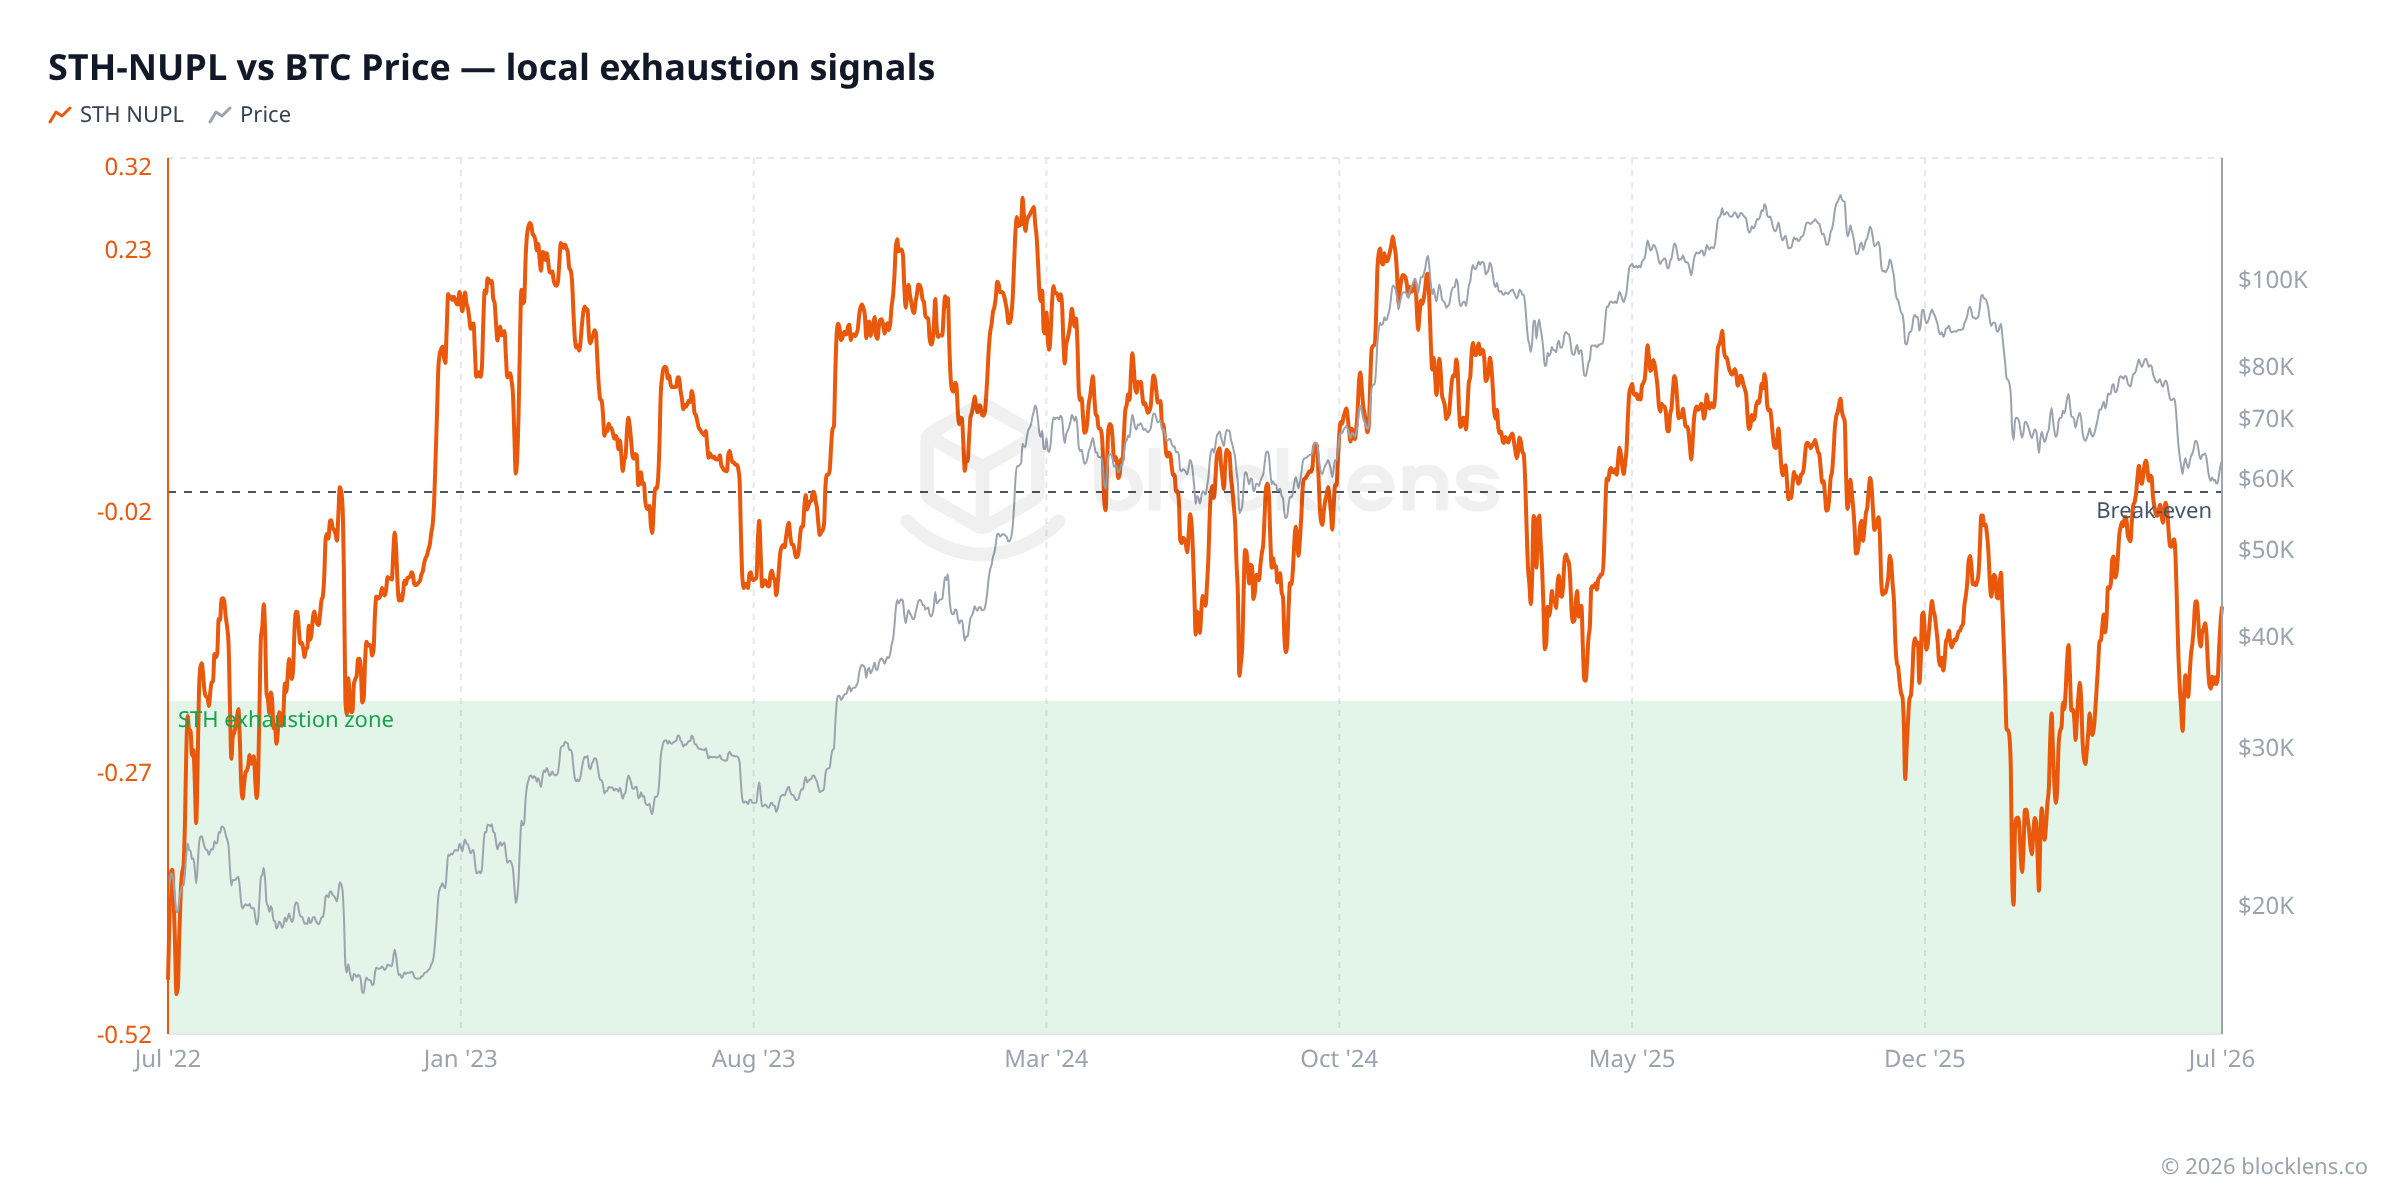
Today STH-NUPL sits around −0.11 — meaningful pain, but shy of the deep exhaustion prints near −0.3 and below that marked the strongest local entry points of recent years. For an active trader, that line between "hurting" and "exhausted" is exactly the distinction worth watching.
Tier note · PRO
NUPL and its cohort variants (LTH-NUPL, STH-NUPL) are Pro-tier metrics on Blocklens — including the STH-NUPL exhaustion gauge from this section.
Reality checkWhat the data says today
Here is the NUPL picture for Bitcoin on 4 July 2026, straight from the Blocklens API:
| Metric | Value | Plain-English meaning |
|---|---|---|
| NUPL (aggregate) | ≈ 0.16 | Hope/Anxiety zone — the network holds modest net profit |
| Emotion band | Hope | Between breakeven and 0.25; early recovery or late-bear limbo |
| LTH-NUPL | ≈ +0.21 | Long-term holders are in the green, sitting comfortably |
| STH-NUPL | ≈ −0.11 | Recent buyers are underwater — the pain cohort |
| Distance to Euphoria (0.75) | +0.59 away | NUPL would need to rise almost 5× from here to reach a top signal |
| MVRV (linked) | ≈ 1.19 | Confirms NUPL: \(1 - 1/1.19 ≈ 0.159\) |
Read it as a story. The network is in the Hope zone — positive but barely. Long-term holders are calm and in profit; recent buyers are hurting. The cycle top emotional signatures — greed giving way to euphoria, NUPL north of 0.5 and climbing toward 0.75 — are nowhere in evidence. This is not a market screaming "sell." It is also not a market screaming "all-clear." It is a market that is cautiously recovering, with the two main cohorts pointing in opposite directions.
Worth knowing
Because NUPL and MVRV are mathematically the same signal, don't double-count them in your analysis. If you note that MVRV is 1.19 (mild profit) and NUPL is 0.16 (Hope zone), those are one data point stated two ways — not two separate pieces of evidence. Treat them as a single read on aggregate profitability: useful for orientation, but always best combined with metrics that capture flows (SOPR, Realized P&L) or cohort behavior (LTH/STH supply) to build a fuller picture.
Putting it to workThe actionable takeaway
How to use NUPL
NUPL's bands are the playbook. Below 0 (fear / capitulation) has historically been the generational accumulation zone. Above 0.75 (euphoria) has historically been the zone to take risk off. Today ≈ 0.16 (Hope) — past the worst fear, far from euphoria, i.e. mid-cycle. Because NUPL = 1 − 1/MVRV, read it together with MVRV as a single read on profitability, and confirm direction with flow metrics (SOPR, Realized P/L).
Caveat: sentiment bands describe how past cycles behaved, not a promise about this one. Not financial advice.
Mini-glossary
- NUPL (Net Unrealized Profit/Loss)
- The network's total unrealized profit (Market Cap − Realized Cap) expressed as a fraction of Market Cap. Capped at +1 on the upside but unbounded below; positive means net profit, negative means net loss.
- Unrealized profit/loss
- The gain or loss a coin's holder is sitting on but has not yet "realized" by selling. If you bought at $30,000 and price is $60,000, your $30,000 gain is unrealized until you sell.
- Euphoria zone (NUPL > 0.75)
- The top band of NUPL — historically reached only at major cycle peaks when the crowd is maximally confident and aggregate profit is extremely high. A caution signal for contrarian analysts.
- Capitulation zone (NUPL < 0)
- The territory where aggregate unrealized losses outweigh aggregate profits. Historically associated with cycle bottoms and generational buying opportunities, but psychologically the hardest time to act.
- LTH-NUPL
- NUPL calculated using only the coins held by long-term holders (unmoved for 155+ days). Tends to be positive in all but the deepest bear markets — experienced holders carry lower cost bases.
- STH-NUPL
- NUPL calculated using only the coins held by short-term holders (moved within 155 days). Tends to go negative during corrections because recent buyers paid near-peak prices. Deep plunges (below roughly −0.2) flag local exhaustion of the cohort — historically useful for spotting short-term entry points.
- MVRV link
- NUPL = 1 − 1/MVRV. The two metrics encode the same information about aggregate profitability. MVRV expresses it as a ratio; NUPL expresses it as a fraction of market cap on a −1 to +1 scale.
The On-Chain Basics series
- What on-chain analysis is — the cost-basis ledger
- Long-term vs. short-term holders (LTH / STH)
- MVRV in depth — reading "cheap vs. expensive"
- SOPR — what coins reveal the moment they're spent
- Realized profit & loss — capitulation and euphoria
- NUPL — the psychology of a market cycle You are here
- Bitcoin's cycles — the halving and the four-year rhythm Next
- The cost-basis "walls" — reading supply by price