When analysts say "the market did this" or "the market did that," they are glossing over an uncomfortable truth: there is no single market. There are, at minimum, two very different crowds of people making very different decisions — and on a good day they barely speak the same financial language.
One crowd has been holding their bitcoin for years. They bought through a crash or two, watched it bounce back, and have largely stopped reacting to short-term price swings. The other crowd bought recently — often near a peak, hoping to ride momentum. When prices fall, these two groups behave in almost opposite ways. And if you look at them blended together, their signals cancel out and you see nothing useful.
The most powerful thing on-chain analysis can do is separate the two crowds. In this article we will see exactly how that split works, why the dividing line is drawn at 155 days, and what the two cohorts are telling us right now.
The core insightOne blockchain, two very different crowds
Think about two Bitcoin holders. Alice bought 1 BTC in 2022 during the bear market at around $18,000. She has not touched it since. Bob bought 1 BTC six weeks ago at around $95,000, chasing the rally after Bitcoin hit its all-time high near $126,200. Both own one coin. Both are on the same blockchain. But their situations — their psychology, their cost basis, their likely next move — could not be more different.
Alice is sitting on a large gain. A 20% price drop barely registers to her; she has survived much worse. Bob, on the other hand, is already deep underwater. A 20% drop means a serious paper loss on a recent purchase. He is far more likely to panic and sell.
This is the fundamental problem with looking at "the market" as a single thing. The price-chart average of Alice and Bob tells you almost nothing useful. You need to look at them separately.
On-chain analysis can do exactly that, because the blockchain knows how long every coin has sat still.
The 155-day lineWhere patient hands separate from nervous ones
How do analysts decide where to draw the line between "patient holder" and "recent buyer"? The answer is statistical — and it is more elegant than any arbitrary choice.
Researchers studying the blockchain noticed something interesting: once a coin has not moved for roughly 155 days, the probability that it moves on any given day drops sharply. Before 155 days, coins change hands with some regularity. After 155 days, they enter a kind of dormancy. Owners who have held through a five-month period — spanning at least one or two significant market swings — have implicitly demonstrated they are not the reactive type. They ignored the volatility and kept holding.
That behavioral shift in the data is the basis for the two cohorts that anchor all of on-chain analysis:
- Long-Term Holders (LTH): coins that have not moved for 155 days or more. These are the patient, conviction-driven holders — sometimes called "diamond hands." They tend to accumulate during fear and distribute (sell) only in euphoria near cycle tops.
- Short-Term Holders (STH): coins that moved within the last 155 days. These are recent buyers — reactive, price-sensitive, and far more likely to panic-sell during drawdowns.
Key idea
LTH supply = conviction. STH supply = speculation. Watching coins cross the 155-day line shows you wealth transferring between patient and impatient hands — and the direction of that transfer tells you where the cycle stands.
The 155-day threshold is not a hard law of nature. But it is grounded in observed behavior across more than a decade of Bitcoin data, and it has proven to be a remarkably stable dividing line through multiple market cycles.
Under the hoodWhy 155 days — and why it's a smooth curve, not a hard switch
Two questions usually come up here: where does the number 155 actually come from, and does a coin really flip from "short-term" to "long-term" the instant it turns 155 days old? Both have precise answers, and they are worth knowing even at a beginner level.
Where the number comes from
The threshold falls out of one simple measurement: how likely is a coin to be spent, as a function of how long it has already sat still? Plot that probability against coin age and you get a steep, smooth decline — a coin dormant for 3 days is far more likely to move tomorrow than one dormant for 300 days. Glassnode's original study, Time is Money, found this decline follows a clean power law in age, and that somewhere around five months the curve flattens into genuine dormancy. The 155-day mark (about 5 months) is where a coin's owner has statistically "proven" they are not a reactive trader.
This isn't something you have to take on faith. In our advanced research we rebuilt the same spend-probability curve from scratch on Blocklens's own raw on-chain data and confirmed it: spending probability falls off as a power law in age with an excellent fit (R² ≈ 0.997). The 155-day line sits squarely in the region where coins transition from "actively traded" to "dormant."
Why it's a weighting curve, not a cliff
Now the subtle part — and the one almost every beginner explanation skips. If you used a hard cut-off (short-term at 154 days, long-term at 155), the metrics would develop ugly artefacts. Picture a large batch of coins all bought on the same frantic day near a top: exactly 155 days later they would all flip from STH to LTH on the same date, making the cohort lines jump discontinuously for no real behavioral reason.
To avoid that, the standard methodology never flips a coin instantly. Instead it applies a logistic weighting function centered on 155 days with a transition width of roughly 10 days, so each coin is gradually reweighted from short-term to long-term across about two weeks around the threshold:
$$w_{\text{LTH}}(a) = \frac{1}{1 + e^{-(a - 155)/10}}$$Here a is the coin's age in days, and wLTH is the fraction of that coin counted toward long-term-holder supply — with the remaining 1 − wLTH counted as short-term. At exactly 155 days the weight is 0.5: the coin is split half-and-half. By about 135 days it is almost entirely short-term; by about 175 days almost entirely long-term. That S-shaped curve smooths the handoff so the cohort metrics glide instead of lurching whenever a cluster of coins crosses the line.
One practical refinement in the Blocklens implementation: we clamp the curve at its edges. Coins younger than 100 days are counted fully as short-term (weight 0), and coins older than 210 days fully as long-term (weight 1); the logistic transition does its smooth work only in the band between. That keeps the very young and very old coins cleanly classified while preserving the gentle handoff around the 155-day midpoint.
Sources & further reading
The 155-day threshold and its logistic-weighting refinement come from Glassnode's foundational work — Rafael Schultze-Kraft, "Quantifying Short-Term and Long-Term Holder Bitcoin Supply" — which built on the coin-age spend-probability analysis in Glassnode's "Time is Money: How Coin Age Shapes Bitcoin's Spending Patterns" (2024). Blocklens independently replicated that underlying spend-probability power law on raw on-chain data (R² ≈ 0.997) in our advanced research. Throughout this beginner series we follow the established Glassnode 155-day convention.
The supply splitWhere do all the coins actually live right now?
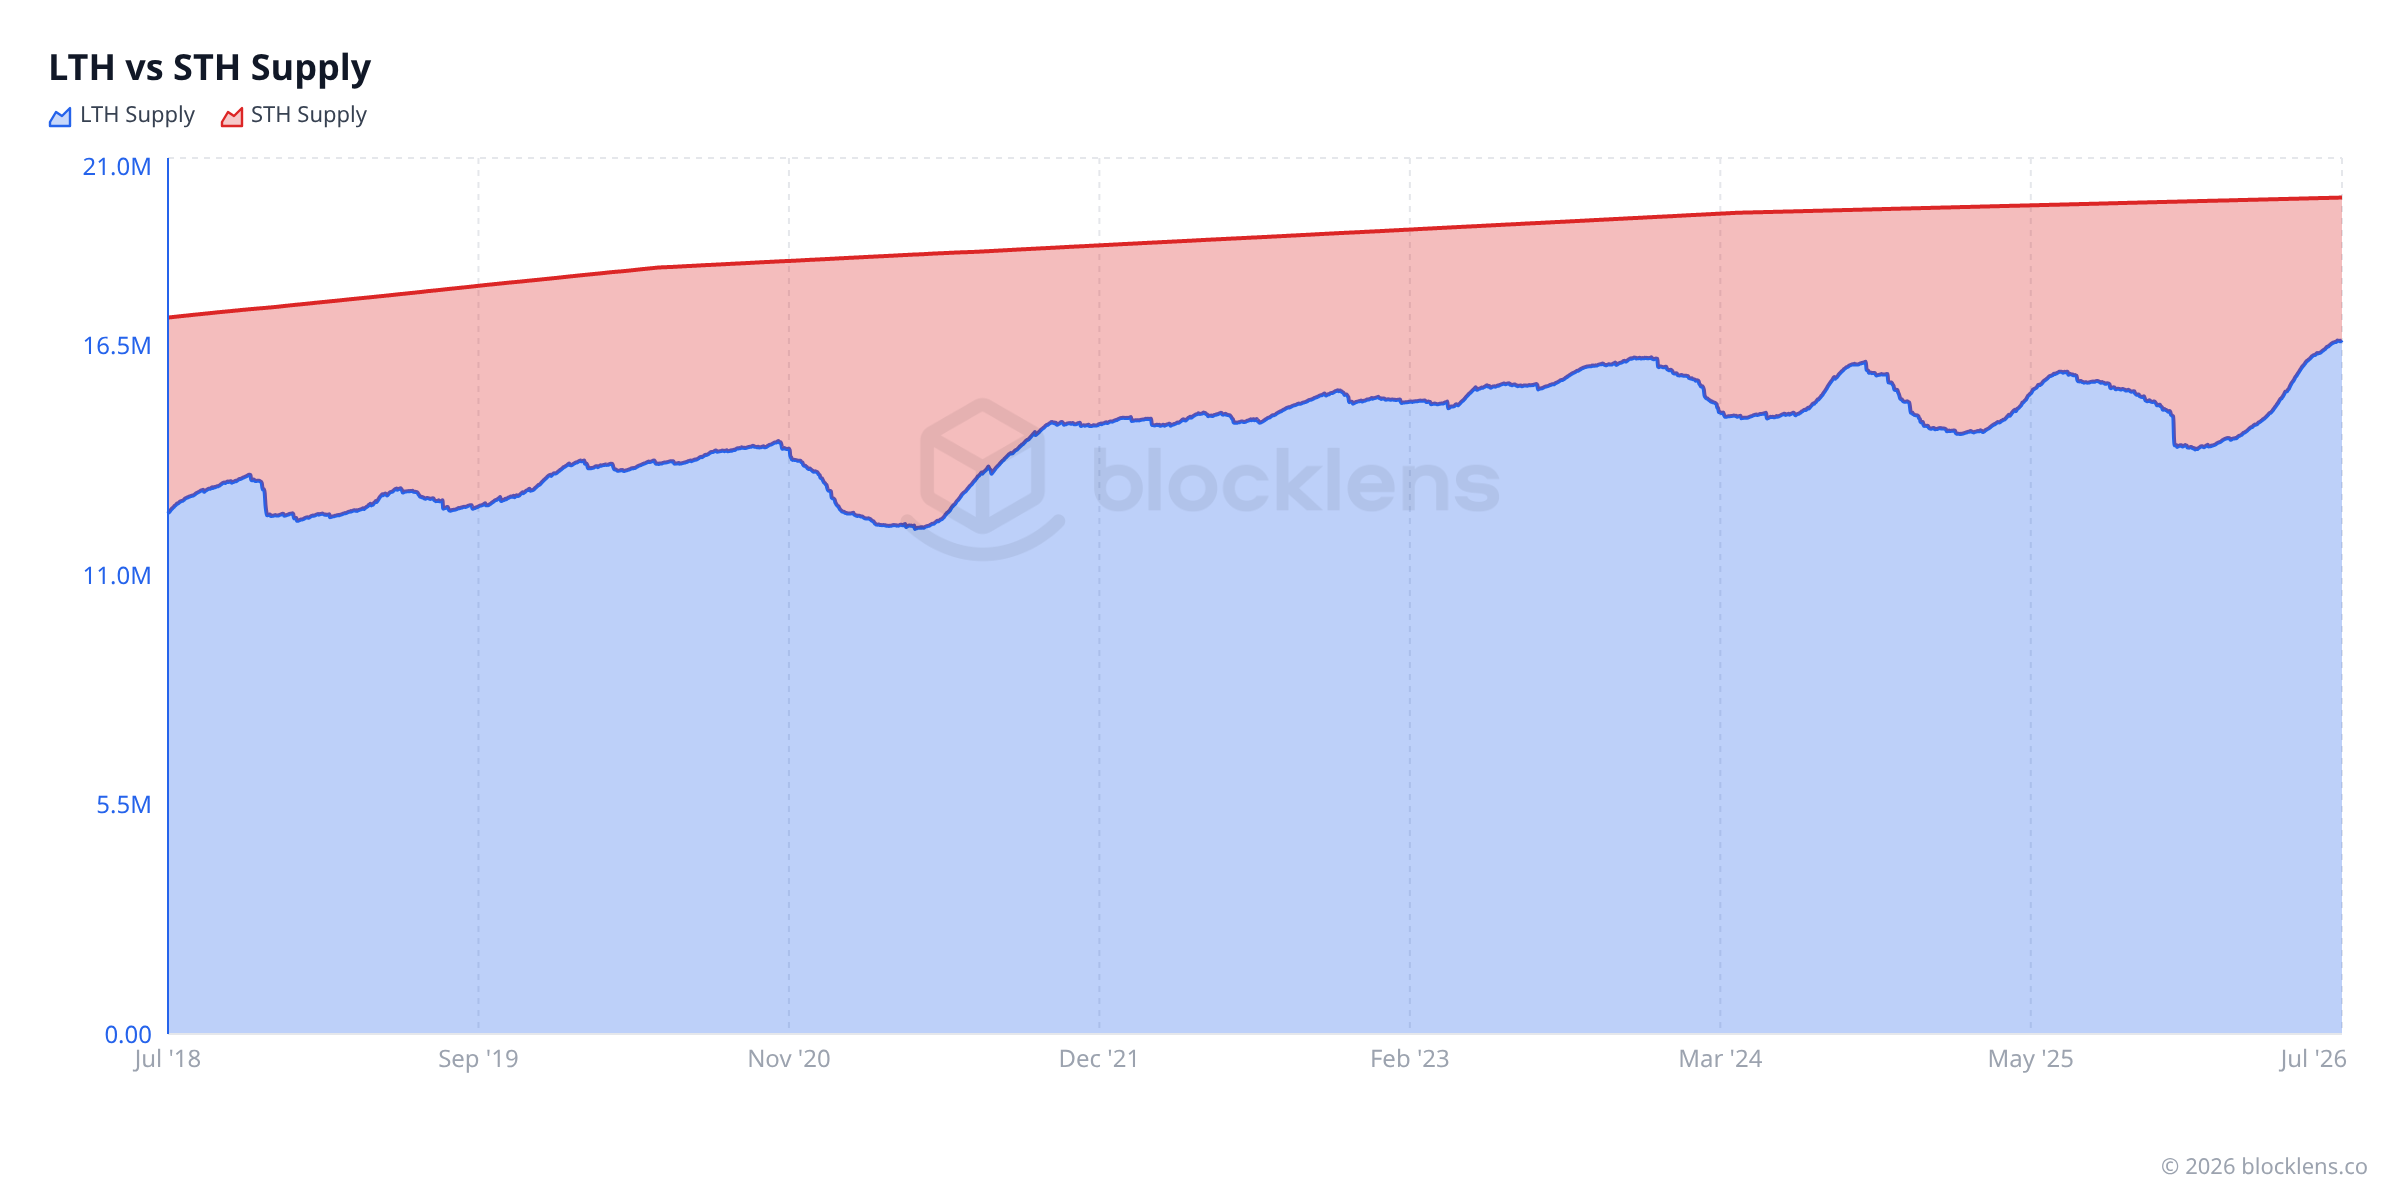
With those definitions in hand, we can ask: of the roughly 20.05 million bitcoin in existence today, how many sit with long-term holders and how many with short-term holders?
The numbers tell a striking story. As of 4 July 2026:
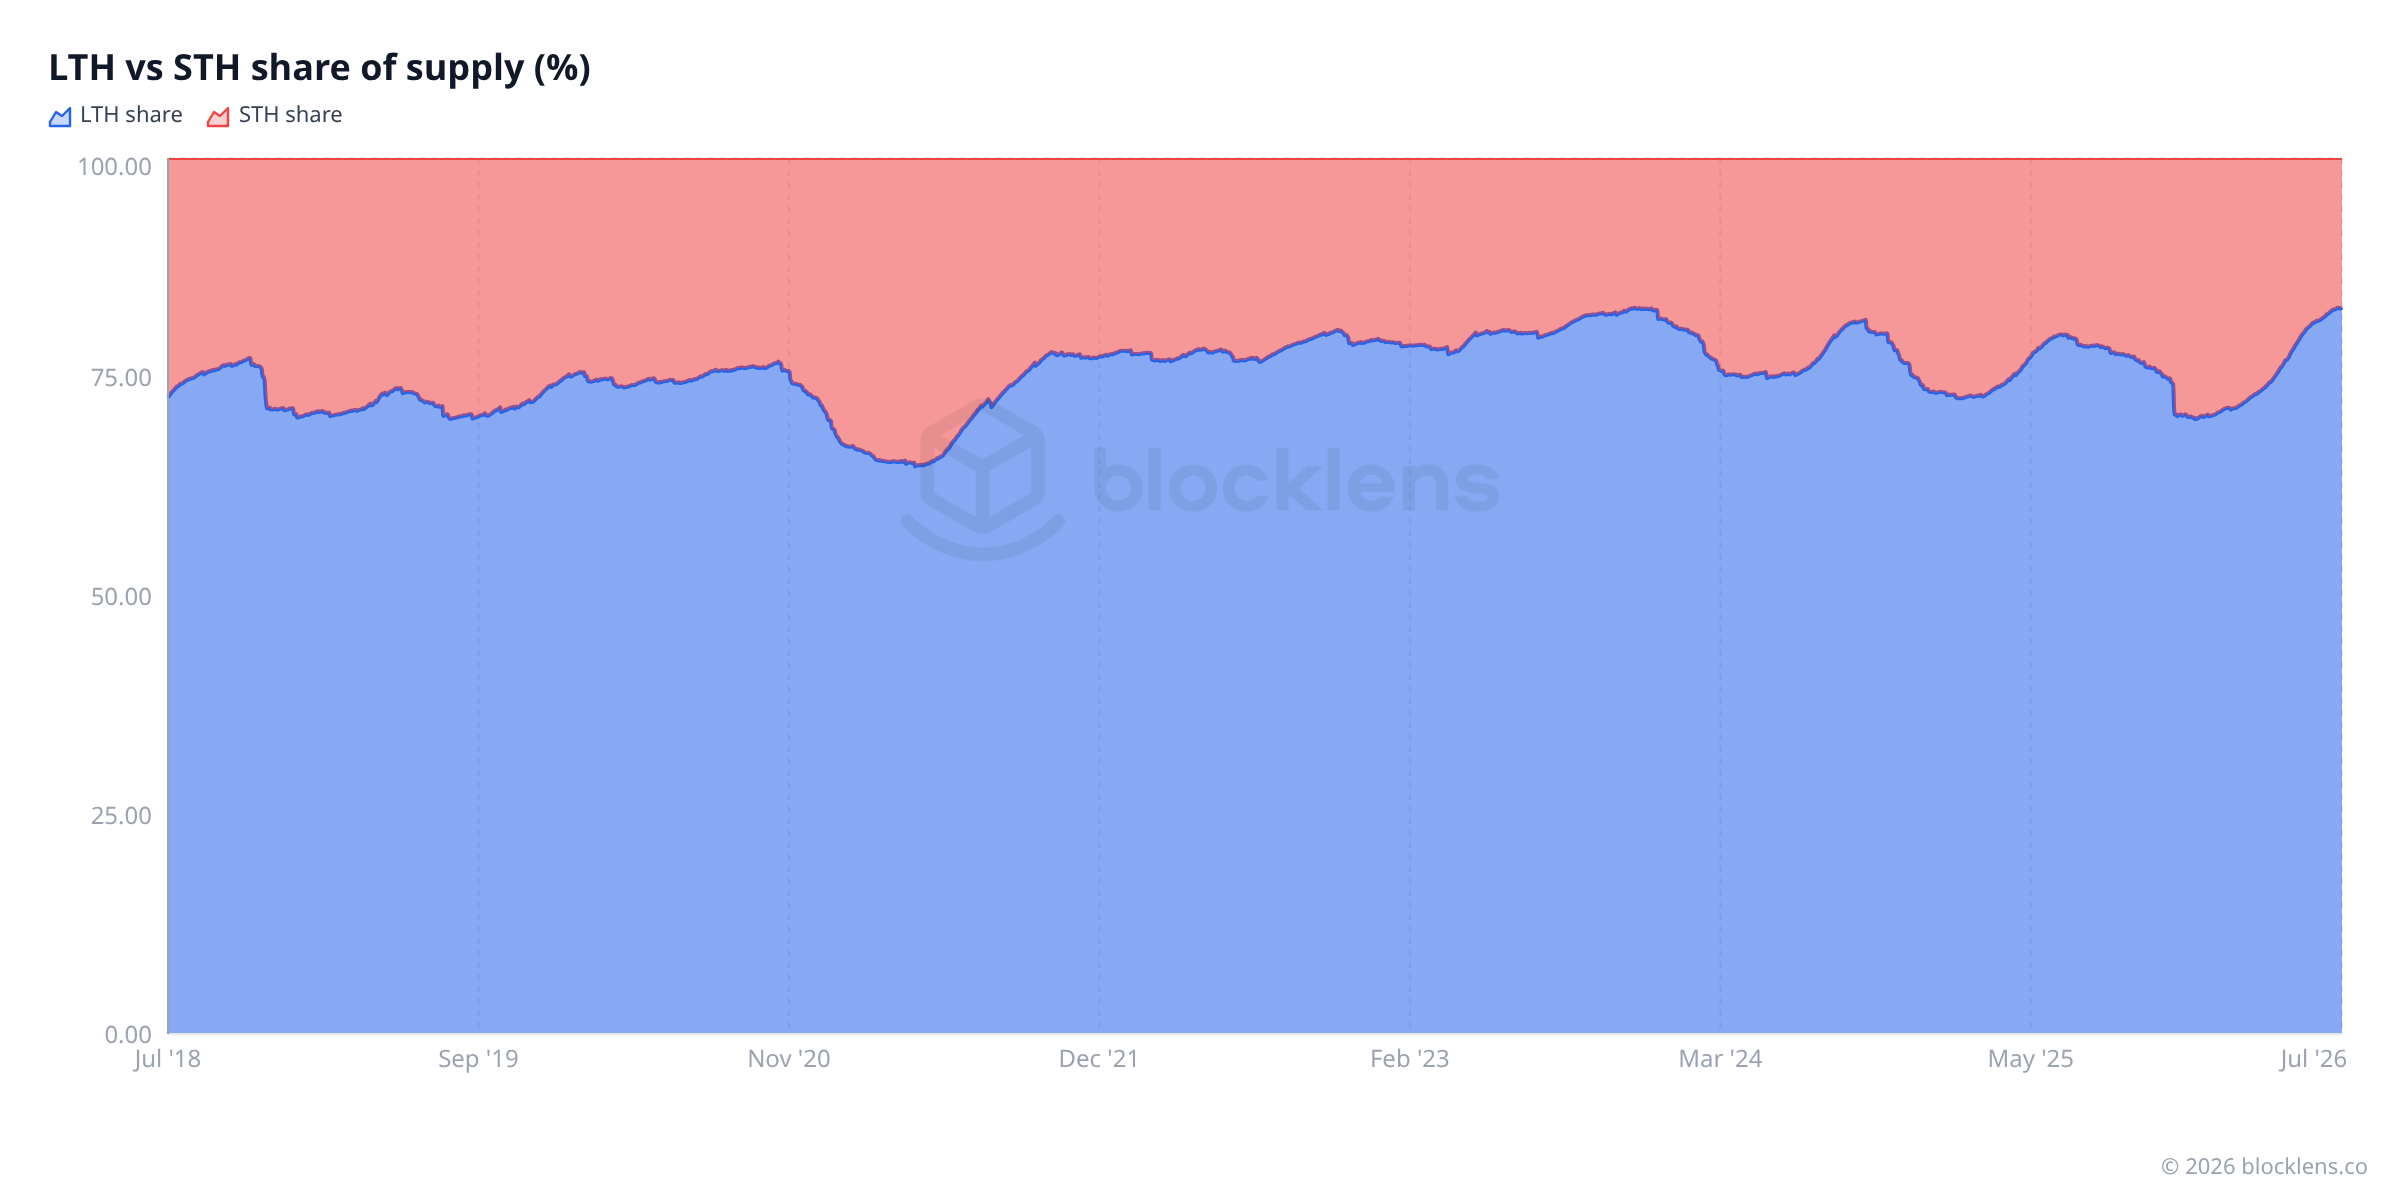
- LTH supply: ≈ 16.63M BTC — that is 83.0% of all circulating coins sitting dormant, held by patient hands who have not moved them in at least five months.
- STH supply: ≈ 3.42M BTC — just 17.0%, held by recent buyers.
Over 80% of all bitcoin is in the hands of long-term holders. That single fact has enormous implications for how freely supply can come to market. When LTHs are holding and not selling, the available float — the coins actually likely to be sold — is a small fraction of total supply.
The raw band heights are useful, but the cleanest way to see the behavioral cycle is to plot the two cohorts as a share of total supply, where they always add up to 100%:
Worth knowing
Lost coins — coins whose private keys are permanently inaccessible — also count as LTH supply, since they haven't moved and never will. Analysts estimate Satoshi Nakamoto's early coins (roughly 1 million BTC, never moved) are in this category. This means LTH supply has a "floor" that never comes to market, making the behavioral signal from active LTH accumulation and distribution even more meaningful than the raw number suggests.
Cohort cost basisWhat each group paid — and the two patterns it reveals
Splitting supply by time is only the beginning. The next step is to apply the same Realized Price logic from Part 1 — but separately to each cohort. Instead of one network-wide average cost basis, we get two: one for long-term holders, one for short-term holders.
These are called the LTH Realized Price and the STH Realized Price. They are computed exactly like the network Realized Price, but only counting the coins in each cohort.
Today, those numbers reveal a fascinating split:
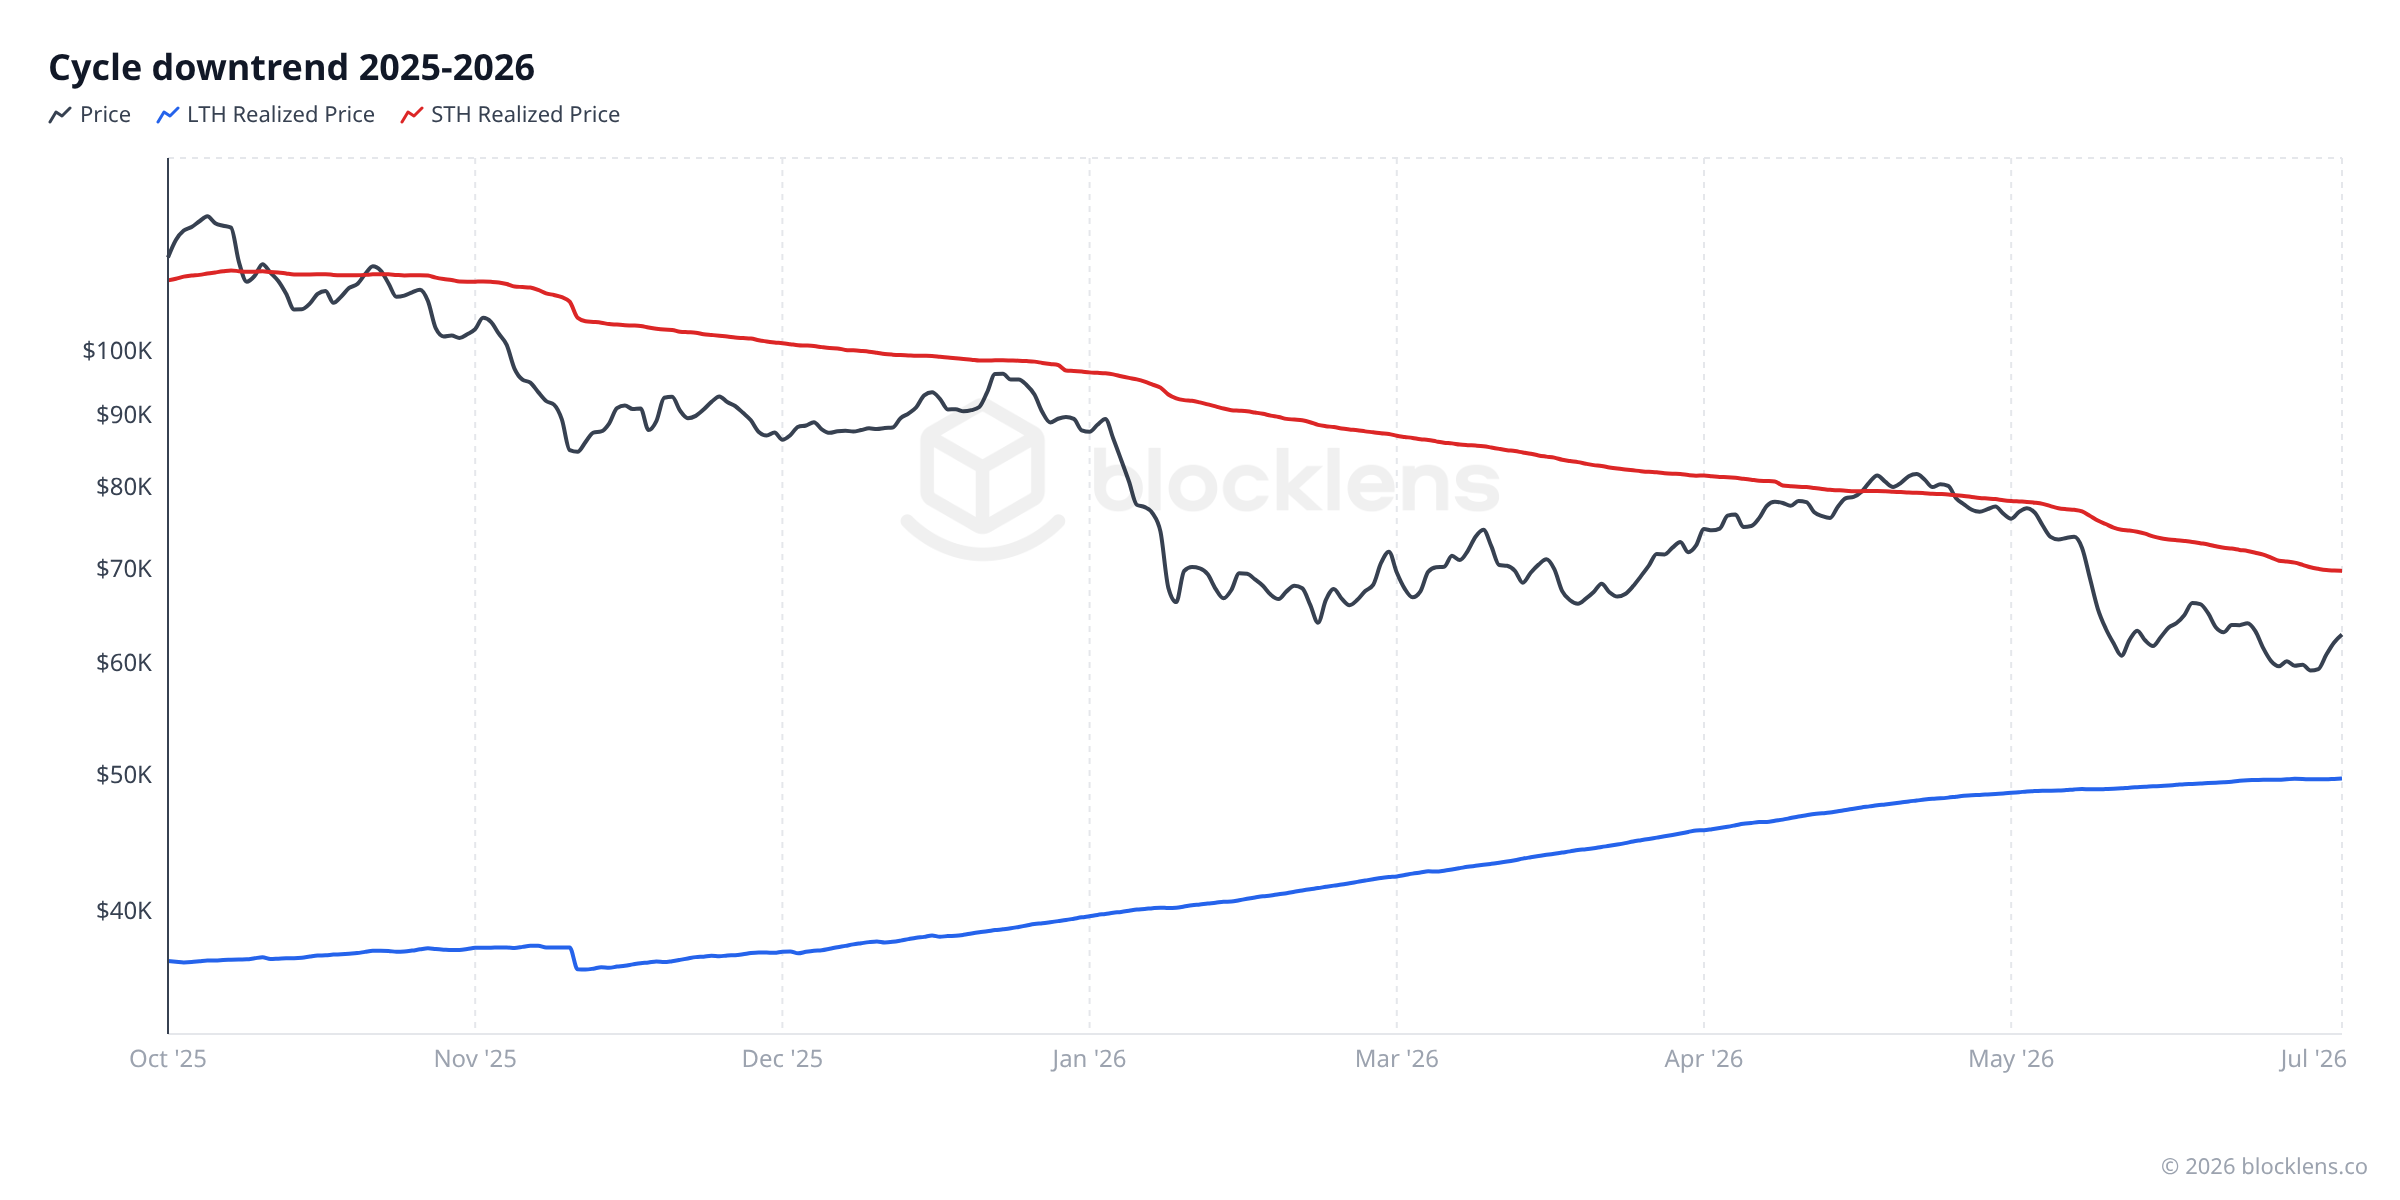
- LTH Realized Price ≈ $49,700 — long-term holders, on average, accumulated at around $49,700 per coin.
- STH Realized Price ≈ $69,700 — short-term holders paid around $69,700 per coin, on average.
- Market price ≈ $62,830
Read those three numbers together and the picture is immediate. Long-term holders are sitting on roughly a 27% gain — they are in profit and under no particular pressure to sell. Short-term holders, who piled in (on average) around $69,700, are now about 15% underwater. They are the stressed cohort. Their metric, STH-MVRV, sits at approximately 0.90 — meaning the average recent buyer is holding a loss of about 10%.
This is why the two crowds behave so differently. Profit and loss create pressure. The LTH is relaxed; the STH is looking at a loss and deciding whether to capitulate.
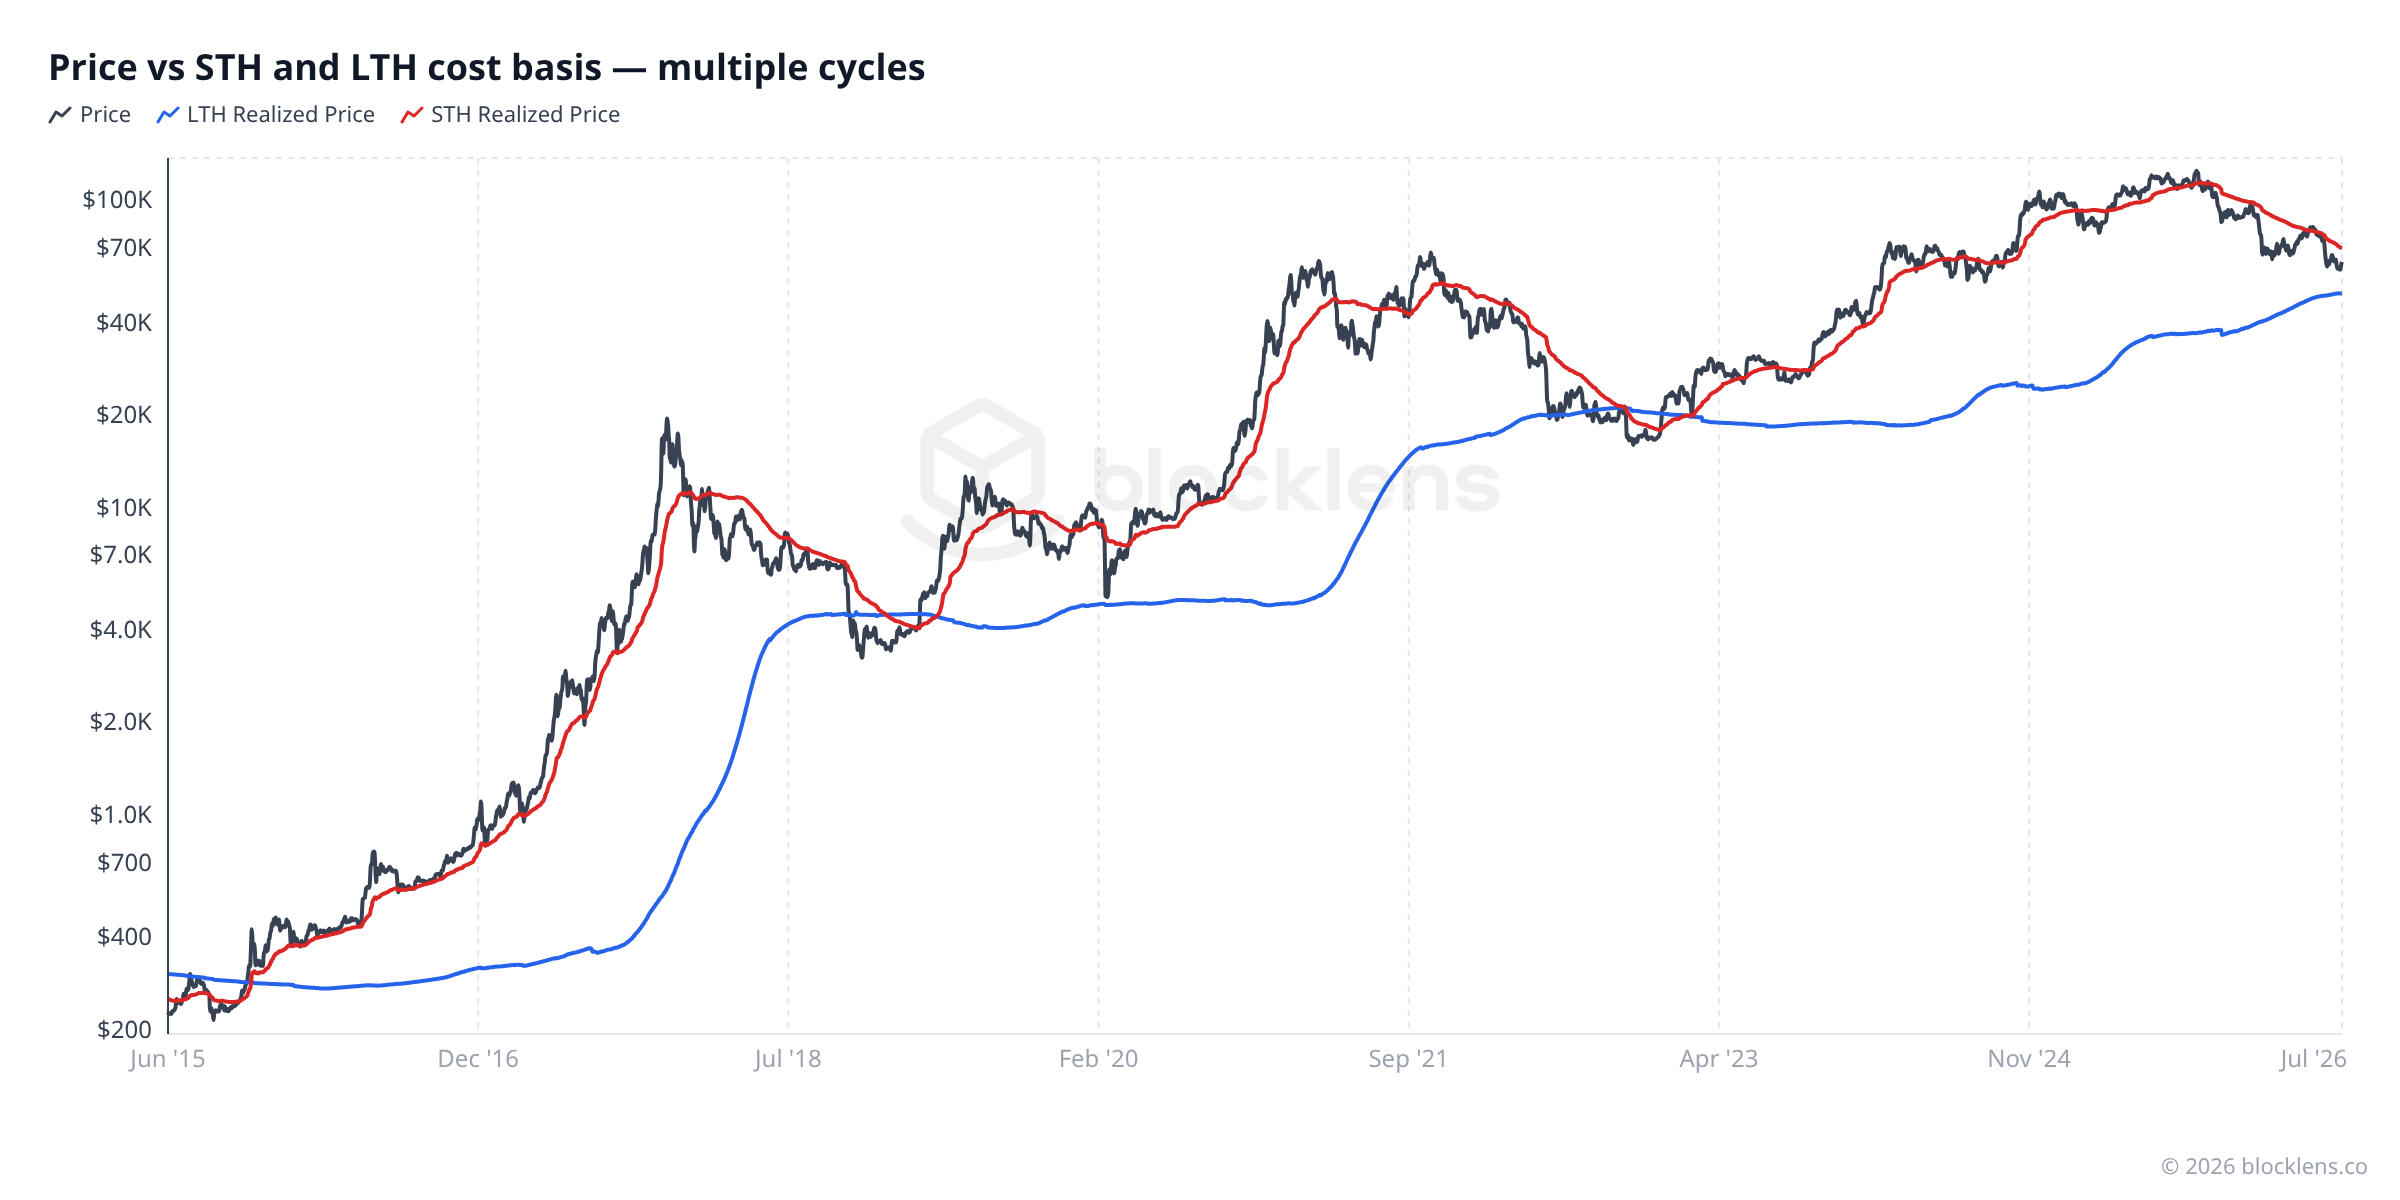
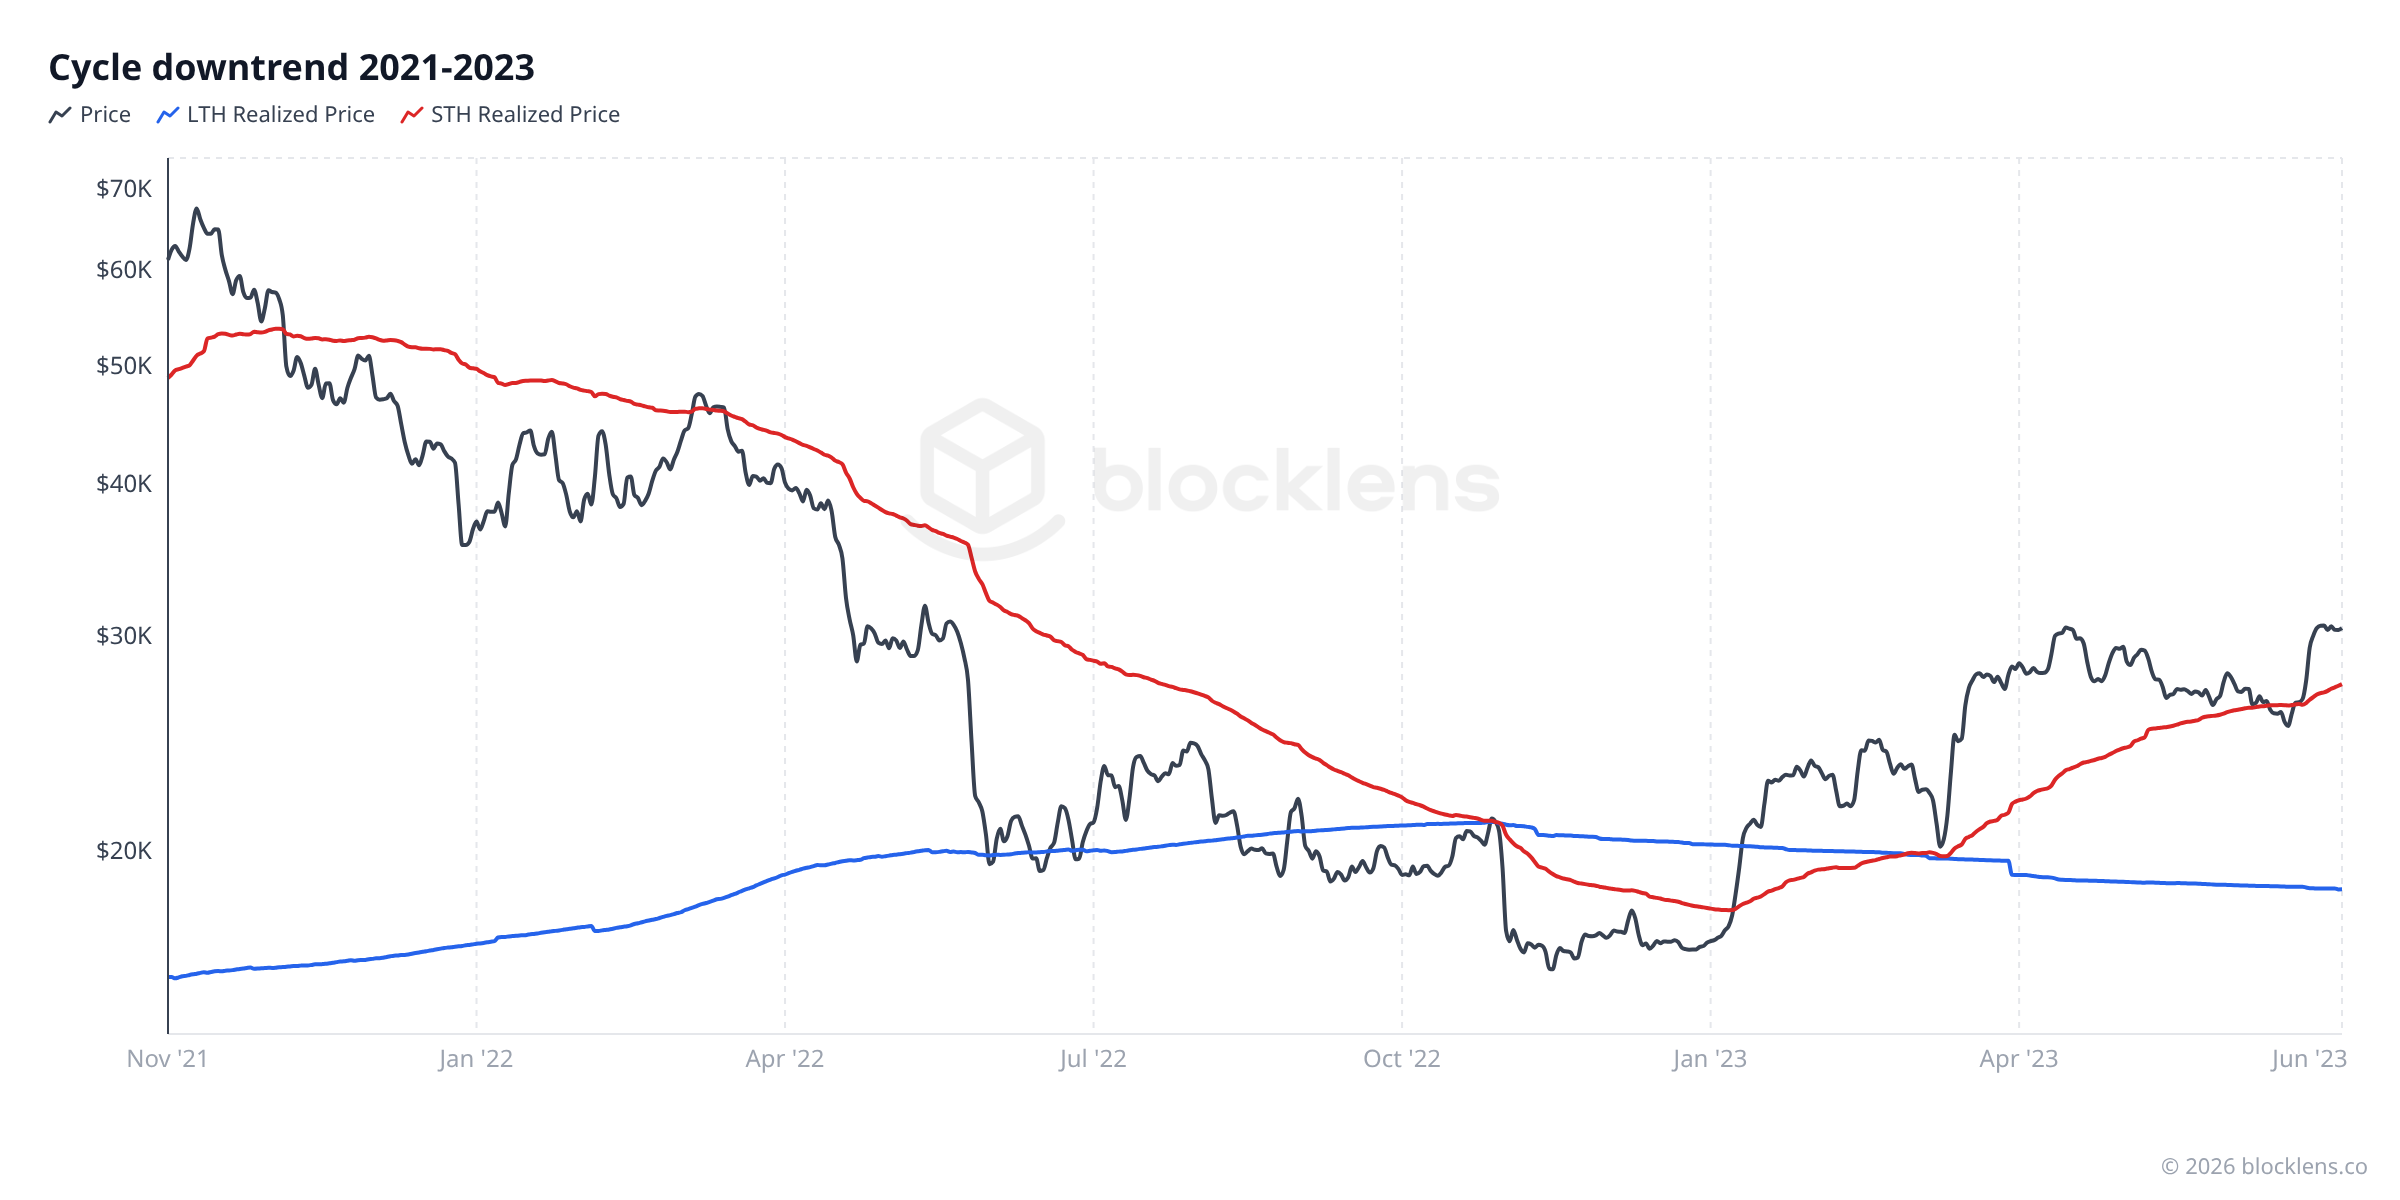
Fact 1 — In a downtrend, STH Realized Price is a ceiling
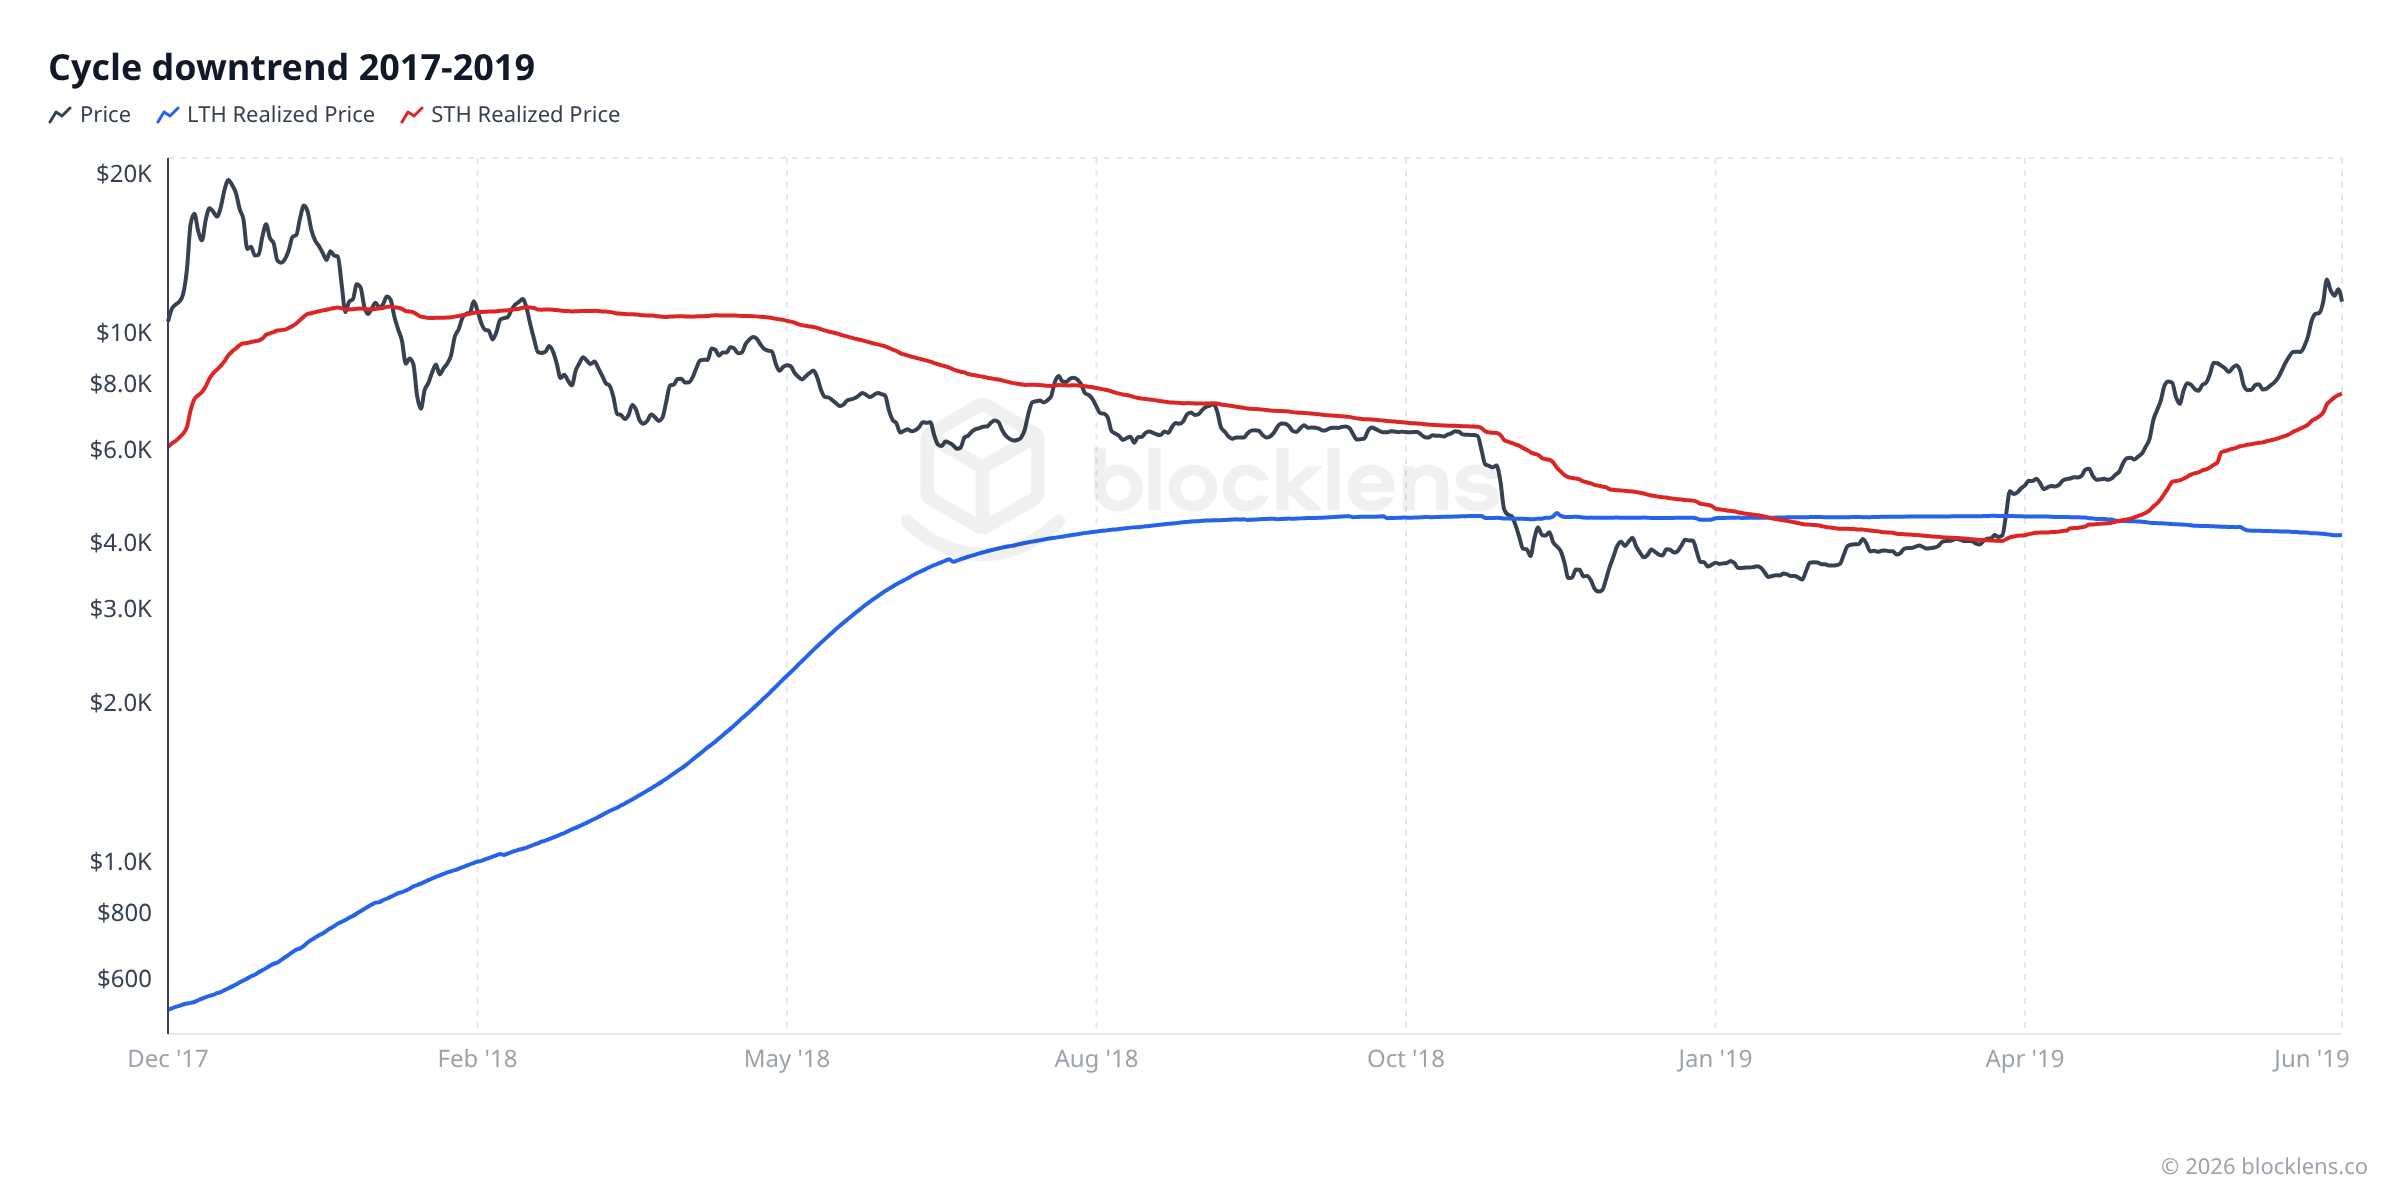
Look at any post-top decline and you see the same thing: price keeps getting rejected at the STH Realized Price (the red line). There is a clean behavioral reason. Short-term holders, on average, bought at the market near the top and then spent months underwater. When a recovery rally finally drags price back toward their break-even — their cost basis — a wave of "just let me get my money back" selling appears. That breakeven-seeking supply caps the rally. So the STH Realized Price behaves as a dynamic resistance level that drifts lower over time as higher-priced buyers give up and the cohort's average cost basis falls. As of 4 July 2026 that dynamic resistance sits around $70,000 (STH Realized Price ≈ $69,700).
Fact 2 — The cycle bottom forms where LTH start to go into loss
Now look at where each decline actually ends. The final low tends to print right around the LTH Realized Price (the blue line) — the zone where even long-term holders, on average, slip from profit into loss. The logic is symmetry: at that point both cohorts hold roughly zero unrealized profit. Everyone who wanted to take a profit, and everyone who was going to panic out at a loss, has already moved their coins. With forced sellers exhausted and cost bases reset, supply and demand re-equilibrate — and the market finds its floor.
This raises a natural question: if the bottom forms where price meets the LTH Realized Price, where will that line be in the months ahead? Unlike the jumpy STH cost basis, the LTH Realized Price moves slowly and methodically — which means, unusually for anything in markets, it can actually be forecast. That is exactly what our advanced research does: the Blocklens-TOP model builds an engine that projects the LTH Realized Price forward, turning the "bottom zone" from a moving target into a track you can follow.
This isn't a one-off. The same two patterns show up in every completed cycle — here they are, side by side:
The actionable takeaway
Two repeatable, cost-basis levels frame a Bitcoin downtrend:
• STH Realized Price = the ceiling. Until a cycle bottoms, expect rallies to stall around it (today ≈ $70,000). A decisive reclaim of this line has historically signalled the trend turning back up.
• LTH Realized Price = the floor. Cycle bottoms have formed in the zone where price falls to the long-term-holder cost basis (today ≈ $49,700) — historically the generational accumulation window.
Right now price sits below the STH ceiling and above the LTH floor — structurally mid-downtrend on this template, not yet at the historical bottom signature. For an investor that maps to a simple, risk-adjusted plan: treat the LTH-cost-basis zone as where you would scale accumulation up, sized to your own tolerance for risk.
Important caveat
These are historical tendencies, not guarantees. Only a handful of cycles exist, and the 2024 arrival of spot ETFs has changed who buys Bitcoin and how. Cost-basis levels describe where supply and demand have tended to balance — they are not a promise about the future. Nothing here is financial advice; use it as one lens, sized to your own risk.
How the cycle worksThe great handoff between patient and impatient hands
Understanding LTH and STH behavior is understanding the Bitcoin market cycle, because the cycle is the handoff between the two cohorts.
Here is how it typically plays out, over and over across Bitcoin's history:
In the bear market and early recovery: price is low or recovering from a crash. Short-term holders who panic-sold have exited. Long-term holders are quietly accumulating — buying cheap coins from anyone who will sell. With each day that passes, newly bought coins age toward the 155-day threshold and migrate from STH supply into LTH supply. The LTH band on the chart gets fatter. These are patient hands being patient.
As the bull market develops: price climbs, media attention returns, and new buyers rush in. These new entrants are, by definition, short-term holders. The STH band begins to swell. Meanwhile, some long-term holders — who bought years ago at much lower prices — see an opportunity to take profit. They start selling their old, cheap coins to eager new buyers. Old LTH supply converts into new STH supply. The LTH band gets thinner. This is distribution.
Near the cycle top: the STH cohort is enormous (everyone just bought) and long-term holders have been distributing for months. MVRV is high, NUPL is in euphoria territory, and the realized price of the STH cohort is very close to the market price — because everyone bought near the top.
When price breaks down: short-term holders, who are already near breakeven or in losses, begin to panic-sell. This is capitulation. Their coins move — some into the hands of opportunistic long-term buyers, some onto exchanges, some at a loss. The STH cohort flushes. With enough pain, the cycle resets.
Key idea
Bull markets are LTH supply converting to STH supply (old coins sold to new buyers). Bear markets are STH supply converting back to LTH supply (new buyers hold long enough to become the patient crowd, or capitulate and hand coins to buyers who then hold). The size and direction of that conversion is the heartbeat of the cycle.
Watching the LTH and STH bands in Figure 1 is, in a very real sense, watching the cycle breathe. The data today — LTH at 83.0% of supply, STH at 17.0%, with STH holders underwater — is consistent with a post-peak bear phase where patient hands are still accumulating and recent buyers are sitting with losses.
Reality checkWhat the data says today
Here is the full LTH/STH snapshot for 4 July 2026:
| Metric | Value | Plain-English meaning |
|---|---|---|
| Market price | ≈ $62,830 | What one bitcoin trades for right now |
| LTH supply | ≈ 16.63M BTC (83.0%) | Coins unmoved for 155+ days — the patient crowd |
| STH supply | ≈ 3.42M BTC (17.0%) | Coins moved within 155 days — the recent buyers |
| LTH cost basis | ≈ $49,700 | Average price long-term holders paid — they are in profit |
| STH cost basis | ≈ $69,700 | Average price recent buyers paid — they are underwater |
| LTH-MVRV | ≈ 1.27 | Long-term holders up ~27% on average |
| STH-MVRV | ≈ 0.90 | Short-term holders down ~10% on average |
The story the table tells: long-term holders are comfortable. They bought their coins at roughly $49,700 on average and are sitting on a healthy gain even though price is 50% off its all-time high. Short-term holders — those who bought near or after the October 2025 peak at $126,198 — are nursing losses averaging about 10%. That cohort is the fragile one. Any further price weakness creates more pressure on them to capitulate, which would hand their coins to the next wave of patient accumulators.
Worth knowing
STH-MVRV at 0.90 is not extreme capitulation by historical standards. In serious bear-market bottoms (2018, 2022), STH-MVRV has gone as low as 0.45–0.55. The current reading is uncomfortable for recent buyers but does not yet signal the kind of mass, forced selling that marks true cycle bottoms. It is worth watching for that metric to approach those historical extremes if price continues lower.
Mini-glossary
- Long-Term Holder (LTH)
- A coin — and by extension, its owner — that has not moved for at least 155 days. These are the patient, conviction-driven participants in the market. Historically they accumulate in fear and distribute in euphoria.
- Short-Term Holder (STH)
- A coin that has moved within the last 155 days. These represent recent buyers who tend to be more price-sensitive and reactive. They are the primary source of capitulation selling in downturns.
- 155-day threshold
- The empirically observed age at which a coin's probability of moving on any given day drops sharply. In practice it is applied not as a hard switch but as a smooth logistic weighting (midpoint 155 days, ~10-day transition width), so coins are reweighted gradually from STH to LTH. Below ~155 days: mostly short-term; above: mostly long-term.
- Cohort
- A group of coins (and their holders) defined by a shared characteristic — in this case, how long the coins have been dormant. LTH and STH are the two primary cohorts in on-chain analysis.
- Realized Price (cohort)
- The average cost basis of a specific cohort — i.e., the average price at which coins in that group last moved. LTH Realized Price and STH Realized Price are computed separately from the overall network Realized Price.
- LTH-MVRV / STH-MVRV
- The MVRV ratio computed for each cohort individually: market price divided by that cohort's Realized Price. Values above 1 mean the cohort is in aggregate profit; below 1 means aggregate loss.
- STH Realized Price as resistance
- In a downtrend, the short-term-holder cost basis tends to act as a falling ceiling: rallies stall where recent buyers can finally sell at break-even. ≈ $70,000 as of 4 July 2026.
- LTH Realized Price as the bottom zone
- Cycle bottoms have historically formed where price falls into the long-term-holder cost basis, the point at which both cohorts reach roughly zero unrealized profit. ≈ $49,700 as of 4 July 2026.
The On-Chain Basics series
- What on-chain analysis is — the cost-basis ledger
- Long-term vs. short-term holders (LTH / STH) You are here
- MVRV in depth — reading "cheap vs. expensive" Next
- SOPR — what coins reveal the moment they're spent
- Realized profit & loss — capitulation and euphoria
- NUPL — the psychology of a market cycle
- Bitcoin's cycles — the halving and the four-year rhythm
- The cost-basis "walls" — reading supply by price